With the release of Tableau Prep in April 2018, analysts have been given an incredibly valuable tool for their analytical kit. Considering both performance and ease of use, prepping your data before it enters Tableau Desktop has many benefits. I’ve created the following walkthrough to demonstrate just one of many data prep scenarios our clients have faced.
Tableau Prep in Practice
Business Goal: How many customers have selected a specific service type?
Data Goal: Rather than concatenating a customer’s selections in a single value (one row per customer), display all service type selections in a single column with one row per customer/service type combination (multiple rows per customer).
Why: This makes it easier to perform analytics on the Service Type field, such as answering questions like, “How many people selected Financial Literacy?”
Original
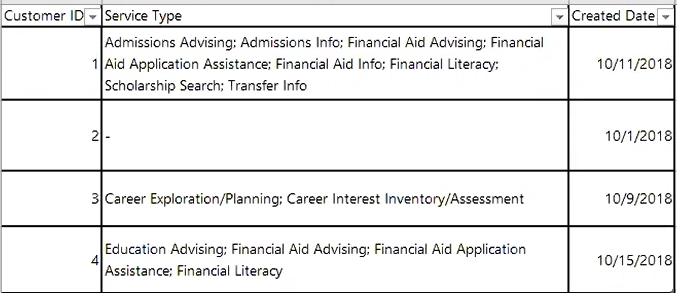
Above: Service Types are concatenated in a single value per customer
Goal
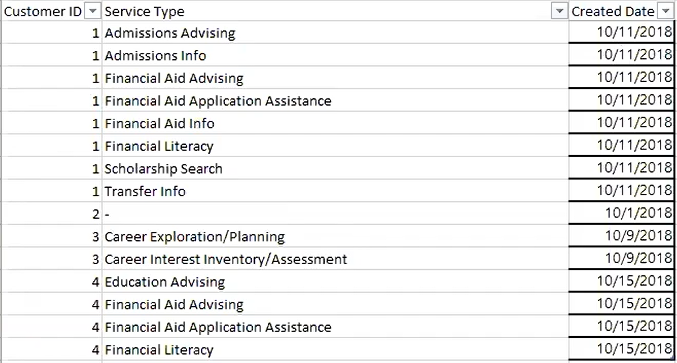
Above: Service Types are listed in one column with rows for each Service Type per customer
How:
Step 1: Connect to data with an Input step.
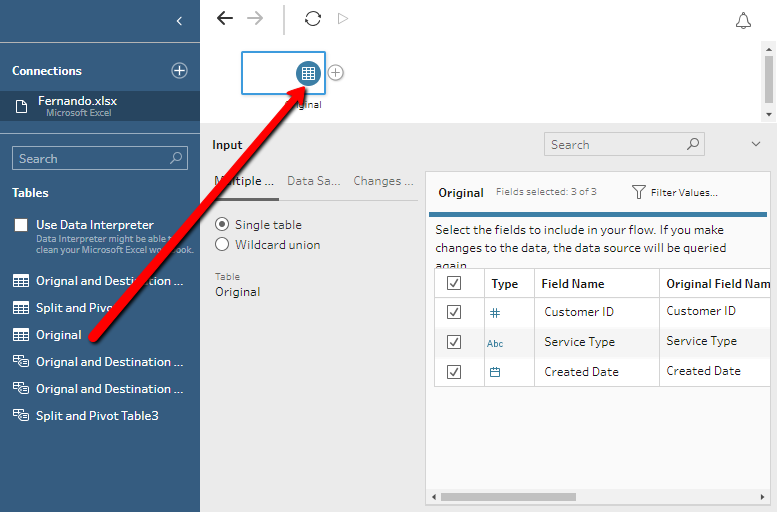
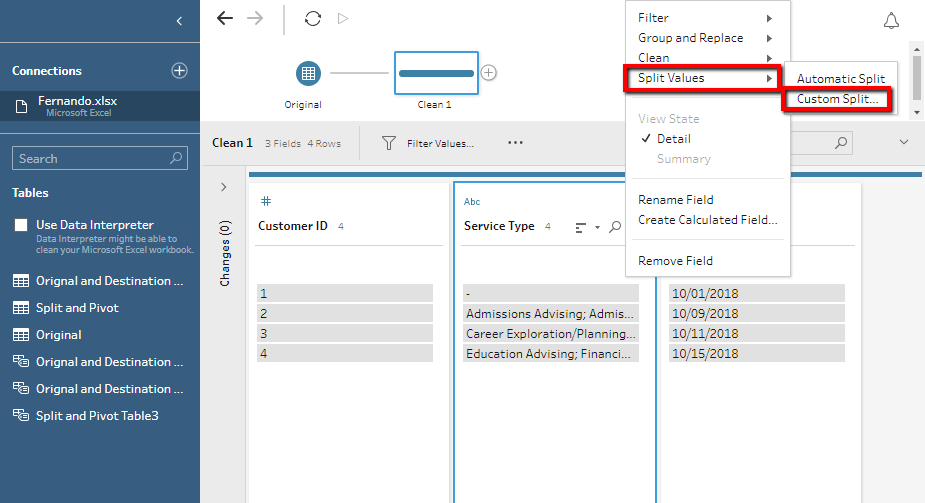
Step 2: Split all values of the concatenated column into separate fields using a Clean step.
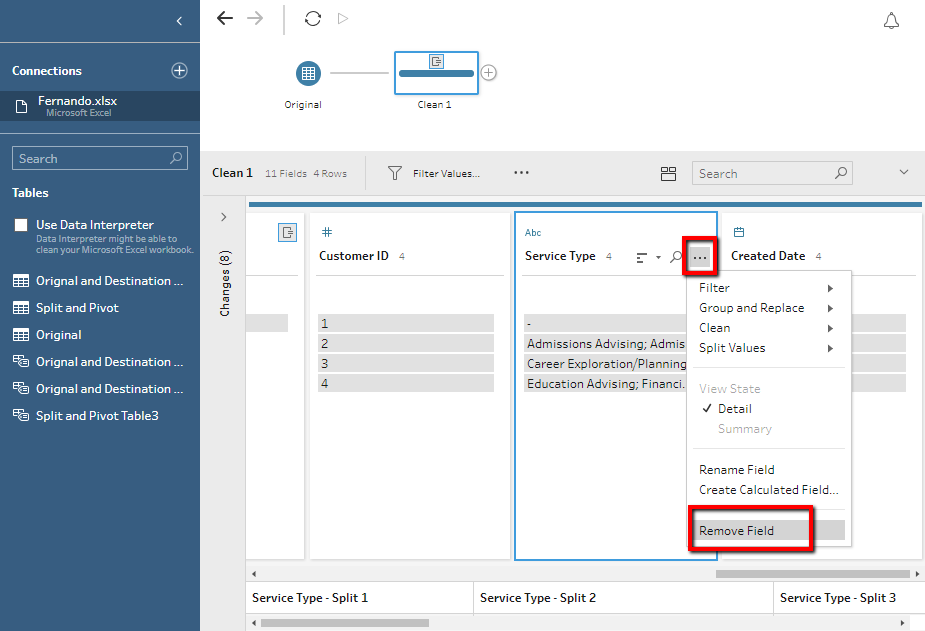
Step 3: Remove the unnecessary, original concatenated column.
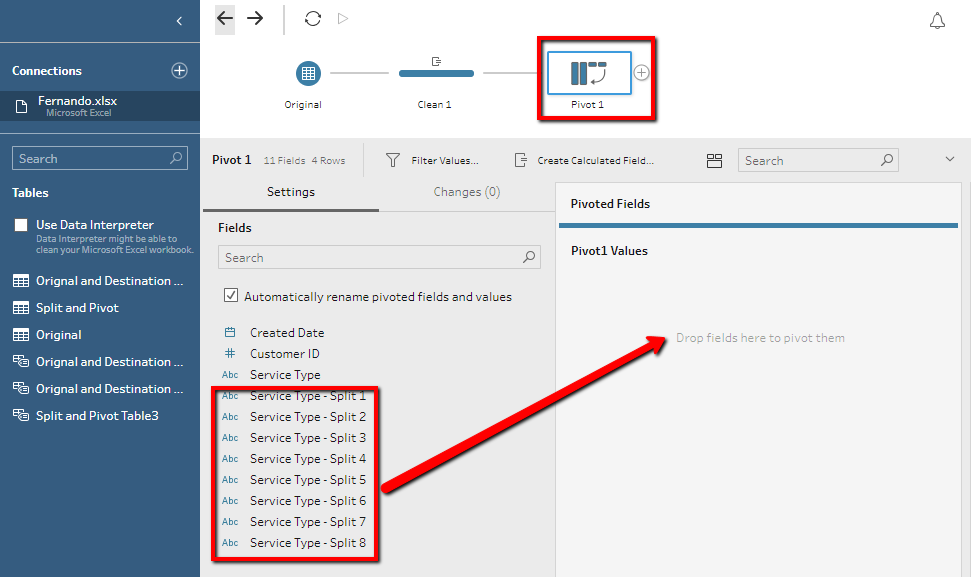
Step 4: Pivot the Split columns using a Pivot step.
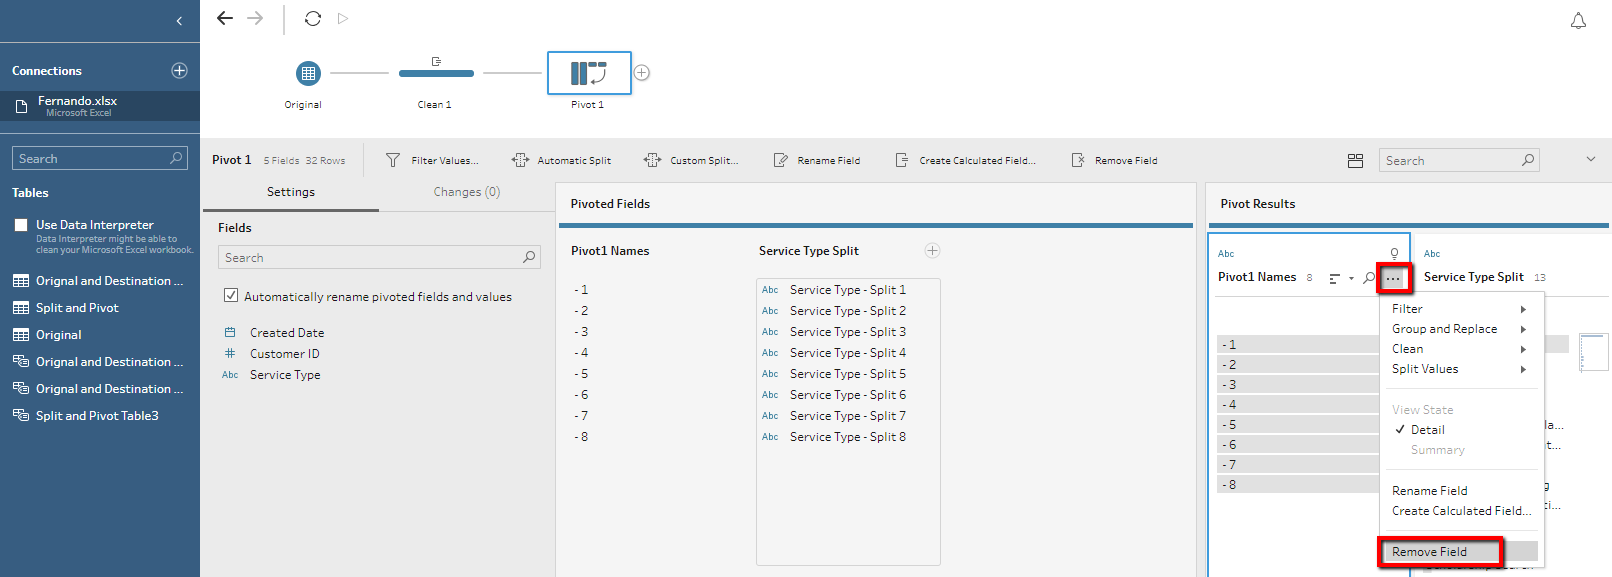
Step 5: Remove the unnecessary Pivot Names field.
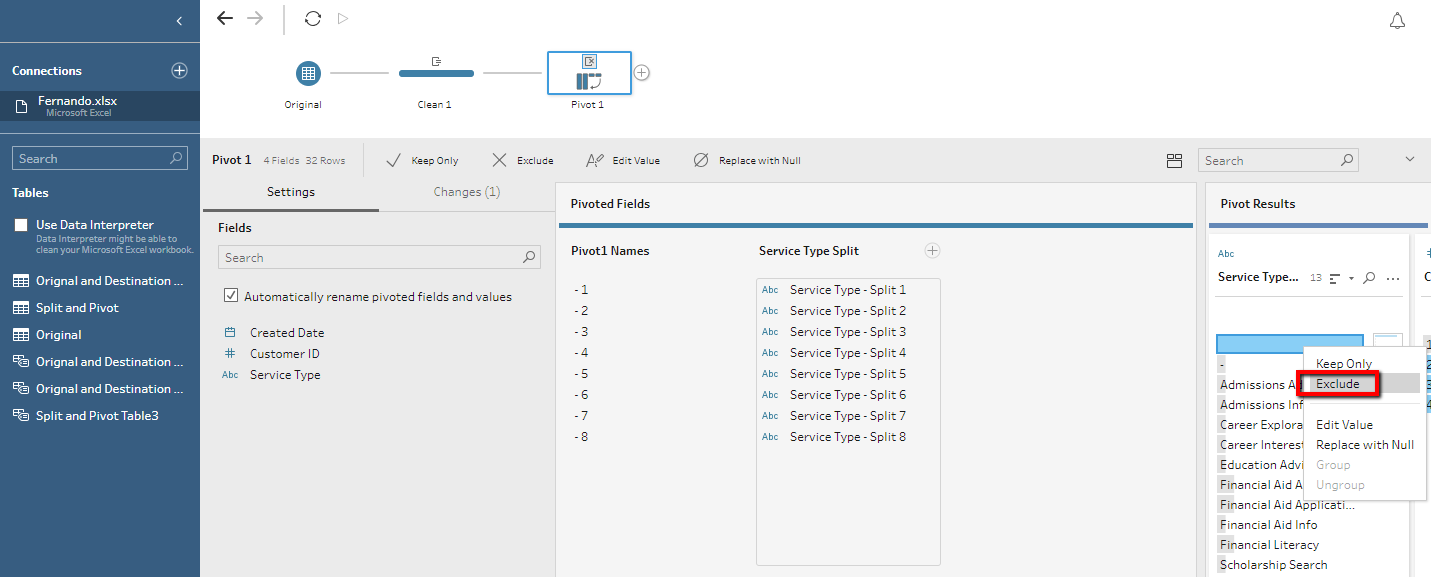
Step 6: Exclude blank values from your new pivoted column.
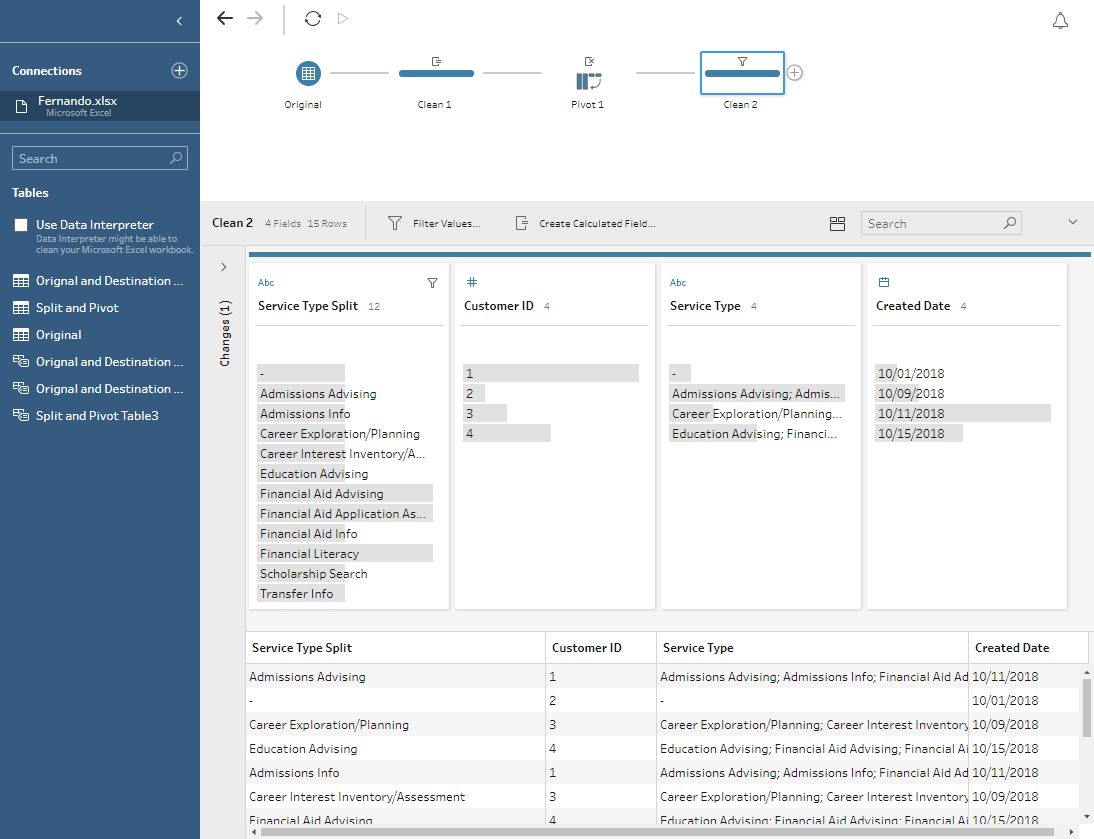
Step 7: Preview results in a Clean step.
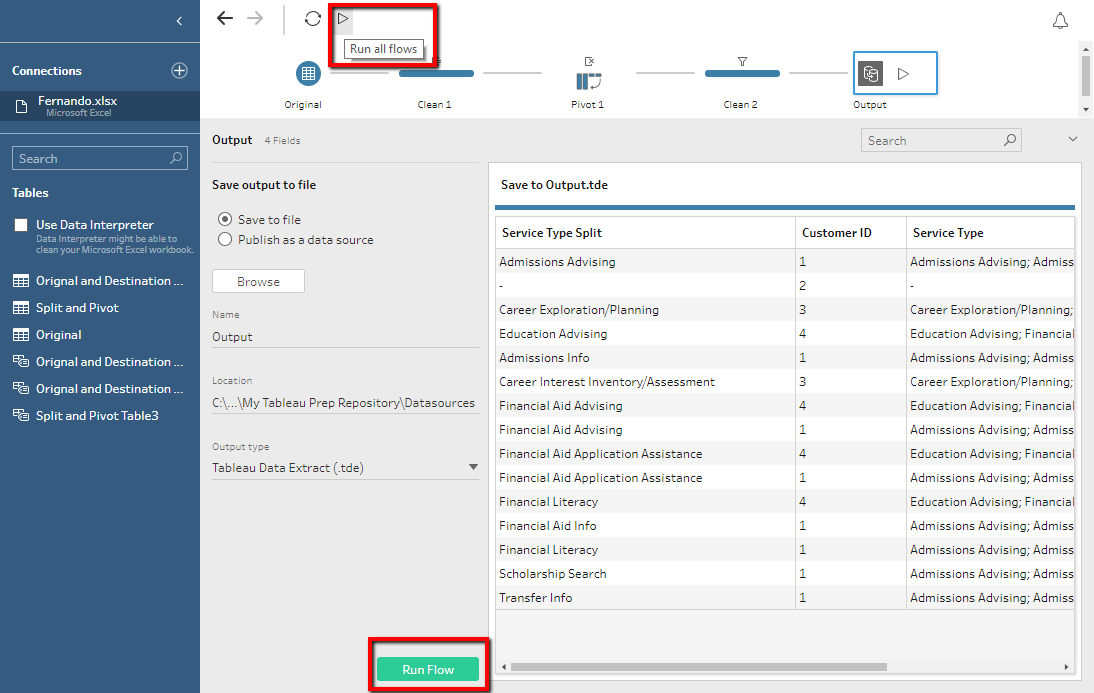
Step 8: Create an Output step.
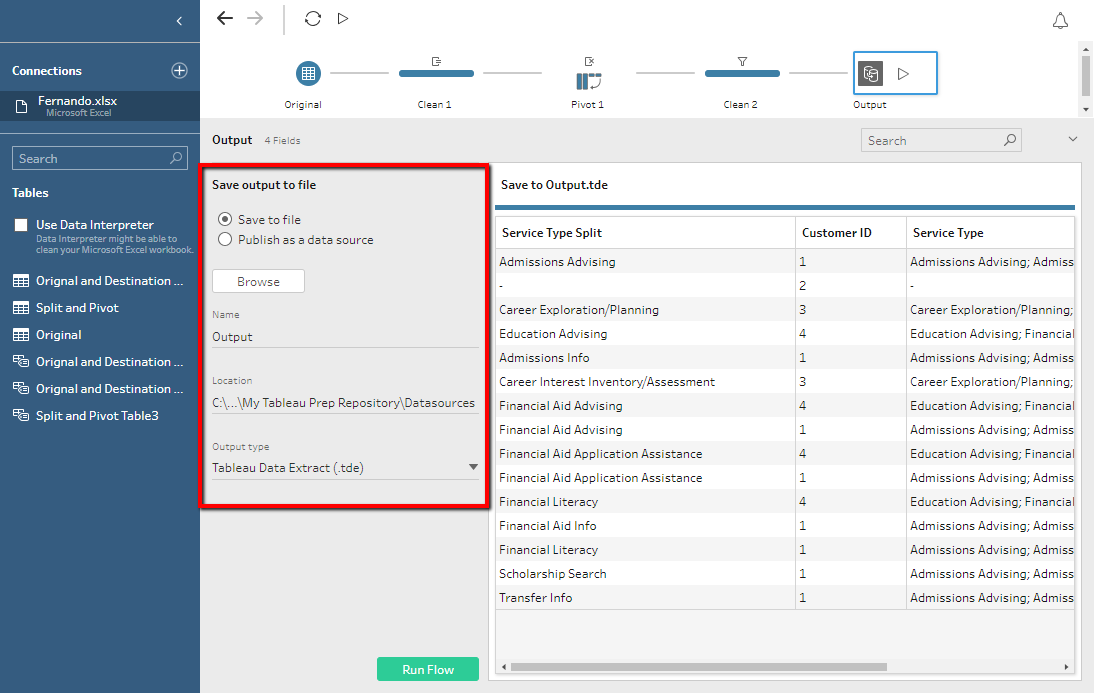
Step 9: Run the flow.
