
We’ve kicked off 2015 with answers to some of our most commonly asked questions. Another problem that appears involves a simple piece of functionality – totals.
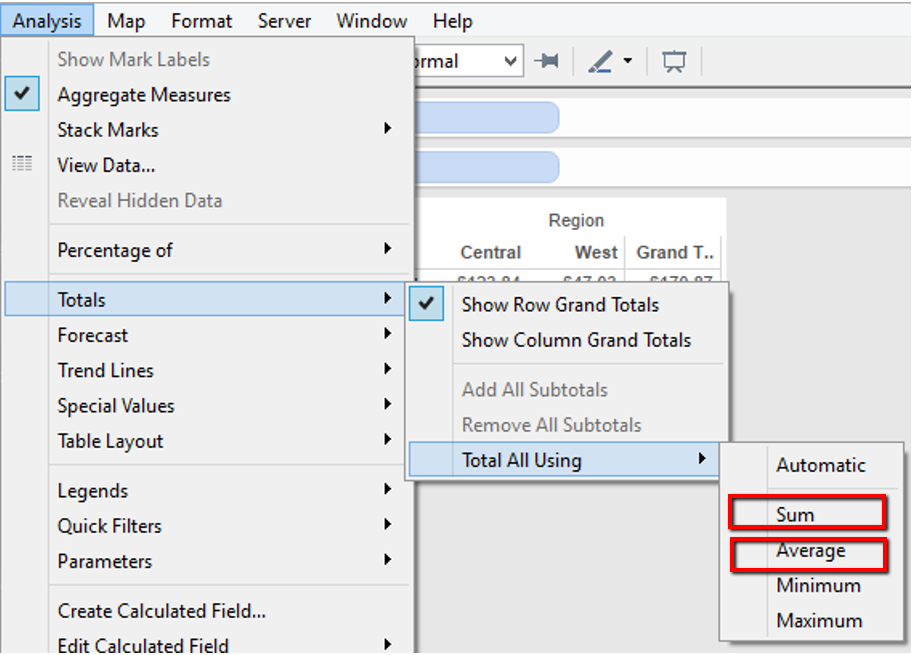
We know that Tableau can create totals for us through the Analysis menu. In Tableau 8.1, a new feature called Two Pass Totals was released. These totals can be calculated as a sum, average, minimum, or maximum by right-clicking on the measure and selecting “Total All Using.” Our goal here is to understand how this feature works by crunching out the numbers in a variety of ways.
We’re going to focus on one product, Geographics Note Cards, and see what happens when we change the aggregation of our measure (Sales) and the way totals are calculated.
The default view shown gives us the total sales for both regions by selecting Analysis > Totals > Show Row Grand Totals. Using Tableau’s default Total All Using – Automatic, the same value would be true if we chose to Total All Using – Sum.
Measure: SUM(Sales)
Total All Using – Automatic (or Sum)
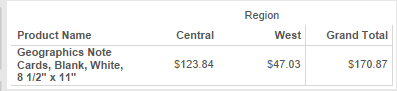
$123.84 + $47.03 = $170.87
Measure: SUM(Sales)
Total All Using – Average
What happens if I change the total computed as an average? The result is a visible average – adding up the values in the view and dividing them by the number of values.
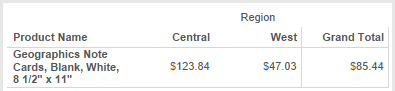
$123.84 + $47.03 = $170.87
/2 = $85.44
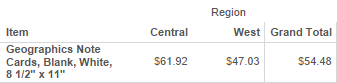
Measure: AVG(Sales)
Total All Using – Sum
This time, instead of changing the way totals are calculated, what happens if I change the aggregation level of the measure? Our result is simply a total of the averages: the average of Central sales + the average of West sales.
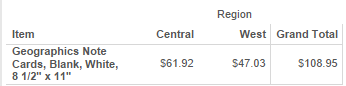
$61.92 + $47.03 = $108.95
Measure: SUM(Sales)
Total All Using – Average
However, what happens if I compute the total as an average as well? The result is an average of the averages.
$61.92 + $47.03 = $108.95
/2 = $54.48
Finding the Solution for Total All Using – Automatic
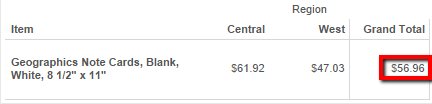
These are all pretty straightforward, but a problem appears when we Total All Using – Automatic. The results aren’t the same as either of the previous selections.
To find our solution, we have to look at the underlying data instead of an aggregate level. Geographics Note Cards were purchased in the Central region on two days, 2/9/11 and 2/26/13. By adding the total sales from each of these orders to the sales from the West region, we see a total sales value of $170.87. Dividing this number by the total number of purchases (3) gives us our final result – $56.96.
Aggregated View:
Detailed View:
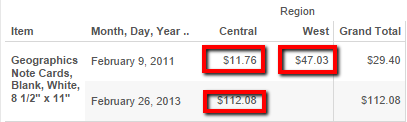
$11.76 + $112.08 + $47.03 = $170.87
/3 = $56.96
I’ve attached a workbook to provide clarity for each of these scenarios. Tableau’s Online Help also provides some great information regarding Grand Totals.
Personally, I know that seeing the numbers written out in an equation can sometimes help to break down the confusion of a crosstab. Hopefully, walking through this simple example gives you a better understanding of Tableau’s extensive functionality and an easier approach when working with your own data.