Deciding to spend six months of your life training for an endurance event isn’t easy. Most people I talk to tell me that it’s crazy, and some even tell me it’s impossible. What’s really at stake in endurance training, though? What do we gain? What do we lose?
Metrics and Tracking
People would often ask me about everything that went into training for an Ironman, such as: correlation of death vs. joy thoughts (pretty high), how many times I threw up (none, yay!) and metrics like speed, distance, time, etc.
Unfortunately, I can’t give you a quantified number of times I was exhausted to the point of tears, or so filled with joy that I was going to explode, or felt like Wonder Woman. What I can share is how many runs, swims and rides both my training partner Dominic Perry and I did in preparation for the Boulder 2017 Ironman.
There’s a new saying among athletes, “Strava or it didn’t happen.” I could argue the days I left my phone and watch at home were some of the most joyful and freeing. Still, per my analysis, the saying is true: If it didn’t happen on Strava, you won’t see it here. So, while we’ve done our best to represent all the activities we did during our six-month training foray, there are a few technical pieces of which you should be aware:
- Not all activities are listed. Sometimes we forgot to use Strava, our watches were dead or we just wanted time with nothing between us and the open road.
- Most swims will not show on the map since they were almost all done indoors without GPS. Strava no longer exports city and state of activity, so indoor swims are not mapped.
- Calorie counts, unfortunately, aren’t listed here due to the Python library I’ve used, which currently has a bug pulling that data.
- We had a wonderful third member of our team whom I had to remove from analysis due to data issues. At the end of the day, she was part of a wonderful team and we wouldn’t have had such a great time without her. Check out her Strava profile: Courtney Kiggins.
My goal in this post was to bring together several technologies and datasets I have been wanting to explore for quite a long time. I worked primarily with the Strava 3.0 API and Python library Stravalib to pull athletes activity data and Tableau to visualize the data.
Using the Strava API
The Strava API is quite extensive and you can pull almost any piece of data they track. The Stravalib allows you to use Python to pull from the API. That said, you can find many other libraries for different languages here.
Pulling athlete information from the Strava API requires a user to create an application under their Strava account. You can see mine below. Strava makes it very easy for users to create the authorization page:
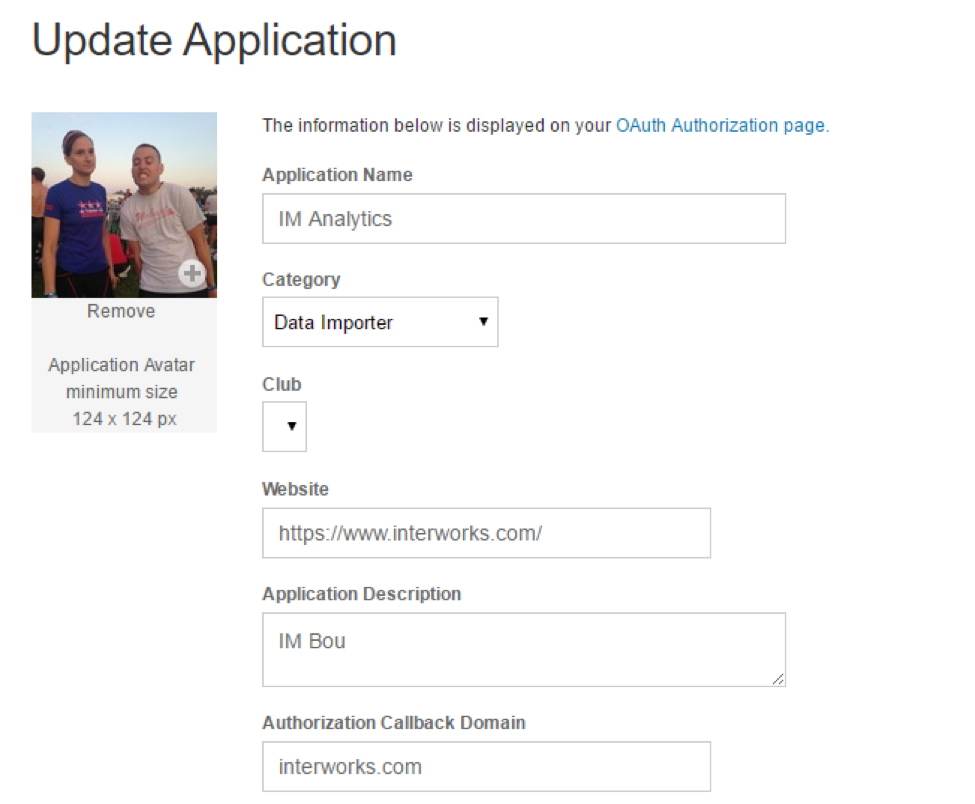
As you can see above, there’s a hyperlink you can select and give to your end users. Since this wasn’t a long-term application for me, I kept it simple and just gave the link to the other athletes. I then had them paste the return URL to me instead of formalizing the process.
The returned URL from an athlete looks like this: https://www.interworks.com/?state=&code=12345abcde
The code can then be exchanged for a token:
from stravalib.client import Client
import string
import sys

code = ''
client = Client()
access_token = client.exchange_code_for_token(client_id='',
                                              client_secret='',
                                              code=code)

print access_token
The code above returns the access token that we can then use to pull athlete activity detail. I originally authorized three athletes. Anything more than that and you may want to formalize the collection of code and exchange for a token.
I took the same strategy in the code below by manually changing the token and running the header/detail for data:
from stravalib.client import Client
import string
import sys

client = Client(
    access_token='')  # Kate: '' #Courtney: '' #Dom ''

athlete = client.get_athlete()

athlete_activities = client.get_activities(after='2017-06-10T00:00:00Z', before='2017-06-12T00:00:00Z')

types = ['time', 'latlng', 'distance', 'altitude', 'velocity_smooth', 'heartrate', 'cadence', 'watts', 'temp', 'moving',
         'grade_smooth']


def print_activity_summary(activities):
     filename = open('C:UsersktreadwellDocumentsIMBOUstravaheader.txt', 'a')
     sys.stdout = filename
     activity_metrics = ['id', 'athlete', 'name', 'distance', 'moving_time', 'elapsed_time', 'total_elevation_gain',
                         'type', 'start_date_local', 'location_country', 'start_latitude', 'start_longitude',
                         'achievement_count', 'kudos_count', 'comment_count', 'athlete_count', 'map', 'trainer',
                         'gear_id', 'average_speed', 'max_speed', 'device_watts', 'average_watts',
                         'max_watts', 'suffer_score', 'average_heartrate', 'max_heartrate', 'average_cadence',
                         'kilojoules', 'average_temp', 'calories', 'description'];

     print '{0} | {1} | {2} | {3} | {4} | {5} | {6} | {7} | {8} | {9} | {10} | {11} | {12} | {13} | {14} | {15} | {16} | {17} | {18} | {19} | {20} | {21} | {22} | {23} | {24} | {25} | {26} | {27} | {28} | {29} | {30} | {31}'.format(
        activity_metrics[0],
        activity_metrics[1],
        activity_metrics[2],
        activity_metrics[3],
        activity_metrics[4],
        activity_metrics[5],
        activity_metrics[6],
        activity_metrics[7],
        activity_metrics[8],
        activity_metrics[9],
        activity_metrics[10],
        activity_metrics[11],
        activity_metrics[12],
        activity_metrics[13],
        activity_metrics[14],
        activity_metrics[15],
        activity_metrics[16],
        activity_metrics[17],
        activity_metrics[18],
        activity_metrics[19],
        activity_metrics[20],
        activity_metrics[21],
        activity_metrics[22],
        activity_metrics[23],
        activity_metrics[24],
        activity_metrics[25],
        activity_metrics[26],
        activity_metrics[27],
        activity_metrics[28],
        activity_metrics[29],
        activity_metrics[30],
        activity_metrics[31]
     )

     for activity in activities:
        print '{0} | {1} | {2} | {3} | {4} | {5} | {6} | {7} | {8} | {9} | {10} | {11} | {12} | {13} | {14} | {15} | {16} | {17} | {18} | {19} | {20} | {21} | {22} | {23} | {24} | {25} | {26} | {27} | {28} | {29} | {30} | {31}'.format(
            activity.id,
            athlete.firstname + ' ' + athlete.lastname,
            activity.name.encode('utf-8'),
            str(activity.distance).replace(' m', ''),
            activity.moving_time,
            activity.elapsed_time,
            str(activity.total_elevation_gain).replace(' m', ''),
            activity.type,
            activity.start_date_local,
            activity.location_country,
            activity.start_latitude,
            activity.start_longitude,
            activity.achievement_count,
            activity.kudos_count,
            activity.comment_count,
            activity.athlete_count,
            activity.map.id,
            activity.trainer,
            activity.gear_id,
            str(activity.average_speed).replace(' m / s', ''),
            str(activity.max_speed).replace(' m / s', ''),
            activity.device_watts,
            activity.average_watts,
            activity.max_watts,
            activity.suffer_score,
            activity.average_heartrate,
            activity.max_heartrate,
            activity.average_cadence,
            activity.kilojoules,
            activity.average_temp,
            activity.resource_state,
            activity.description
        )


def print_stream(activities):
    filename = open('C:UsersktreadwellDocumentsIMBOUstravadetail.txt', 'a')
    sys.stdout = filename
    print '{0} | {1} | {2} | {3} | {4} | {5} | {6} | {7} | {8} | {9} | {10} | {11}| {12} | {13} | {14} |{15} | {16}'.format(
        'activity_id',
        'athlete',
        'name',
        'type',
        'start time',
        'time',
        'heartrate',
        'cadence',
        'watts',
        'velocity_smooth',
        'distance',
        'altitude',
        'moving',
        'temp',
        'lat',
        'lng',
        'calories'
    )

    for activity in activities:
        stream = client.get_activity_streams(activity.id, types=types)
        length = len(stream['time'].data)
        for i in range(0, length):
            print '{0} | {1} | {2} | {3} | {4} | {5} | {6} | {7} | {8} | {9} | {10} | {11} | {12} | {13} | {14} | {15} | {16}'.format(
                activity.id,
                athlete.firstname + ' ' + athlete.lastname,
                activity.name.encode('utf-8'),
                activity.type,
                activity.start_date_local,
                stream['time'].data[i],
                stream['heartrate'].data[i] if 'heartrate' in stream else 'NULL',
                stream['cadence'].data[i] if 'cadence' in stream else 'NULL',
                stream['watts'].data[i] if 'watts' in stream else 'NULL',
                stream['velocity_smooth'].data[i] if 'velocity_smooth' in stream else 'NULL',
                stream['distance'].data[i] if 'distance' in stream else 'NULL',
                stream['altitude'].data[i] if 'altitude' in stream else 'NULL',
                stream['moving'].data[i] if 'moving' in stream else 'NULL',
                stream['temp'].data[i] if 'temp' in stream else 'NULL',
                stream['latlng'].data[i][0] if 'latlng' in stream else 'NULL',
                stream['latlng'].data[i][1] if 'latlng' in stream else 'NULL',
                activity.calories
            )


print_activity_summary(athlete_activities)

#print_stream(athlete_activities)
The code above was built mostly by Brian Bickell. I added and changed fields, added an export to a text file and added the ability to choose a different athlete. There were also some activities that had emojis in their names, so I had to change the encoding to UTF 8 for it to be brought in properly.
There are two different functions: One to pull the summary data of the activity and one to pull the detail of the activity. Due to the non-additive nature of the detailed data, I pulled the summary data for most pieces of information shown. The detailed data is almost exclusively used for mapping the routes of activities.
Pulling the Data into Tableau
In order to pull the data, I ran through each function for each athlete. The data was piped to two different text files: stravaheader.txt and stravadetail.txt. I immediately pulled them both into Tableau.
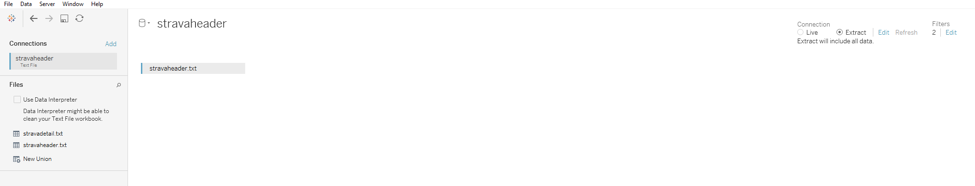
Don’t forget to extract!
The header data is much wider and the detail data is much taller. So, I needed to do some calculations in the data.
Strava exports distance in meters, but I needed to convert them to miles. This is pretty simple process. I just needed to divide by 1609.344. The same went for activity duration, which is returned in seconds. So, we simply took the duration and divided by 60 twice. The more complex calculations came when creating the hex map. A great how-to guide can be found here.
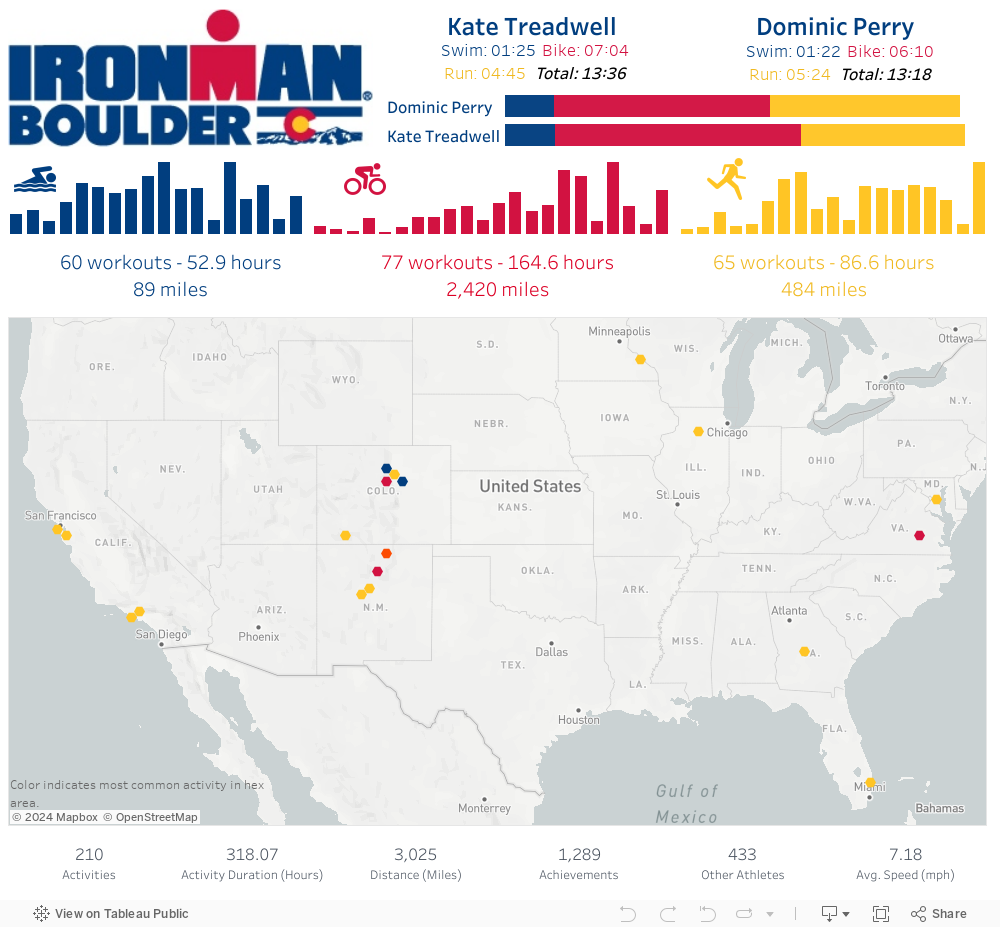
The Tableau Dashboard Explained
The dashboard shows overall and official times for each of us along with a bar chart representing the total Strava time in each activity. Transition times were removed.
Training for an Ironman is a lot about volume. As you get closer and closer to the race, your volume increases. Each bar in the viz shows the total time we spent in a week for an activity. You can see that in the week or two prior to the event, we significantly decreased our volume but increased our intensity. The final bar is the day of the Ironman!
Users can explore the data by selecting an activity in the bar, an athlete or a hex shape on the map. Times, dates, volume and results are all in one dashboard. While there’s no cry-per-run metric, I hope you see what it took to make a dream happen!