I am often asked in my classes when a user would need to use custom geocoding. In Tableau, custom geocoding is a little-known feature that is often underused. In my post today I’m going to go over why you would want to use custom geocoding, and how to add it once you do.
I have been working lately with government datasets available on data.gov in my free time. I really enjoy not only being able to better understand my government, but also being free to share the insights gleaned with everyone. If you have never had an opportunity to go through those datasets, I highly encourage you to do so. There is a wealth of information with which to work, and it is often quite helpful to explore non-secure data.
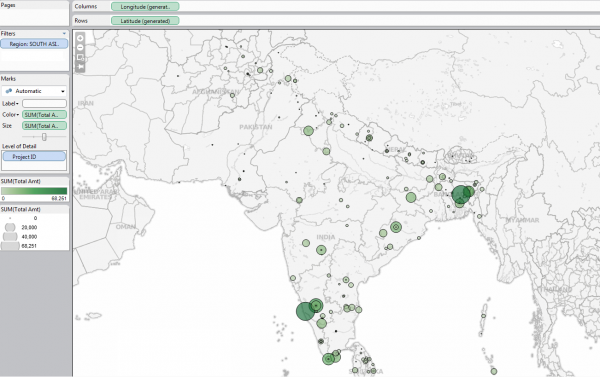
The World Bank which is headquartered Washington D.C., has so much publicly available data I could work through it for months. Recently, I wanted to build some views that analyzed their projects geographically. Many of the datasets only have the project number and not the latitude/longitude associated with that project. Since many of their projects are not tied to cities, postcodes, or provinces directly, I needed some way to locate the projects on a map outside of the dataset.
Here comes the value of custom geocoding. Perhaps you would like to map all of your company’s locations or customers, but only have access to that data in one dataset. Many users add custom geocoding for locations not packaged with Tableau (customers, branches, IP addresses, etc). In Shanghai a few weeks ago, I ran across a few users who needed to add custom geocoding for postcodes in China.
What exactly does custom geocoding do for users though? Have you ever noticed that when you connect to data and have a “Zip Code” or “State” or “Country” field, Tableau gives your field a globe-like icon that if you double click on it produces a map? That is Tableau’s packaged geocoding. Custom geocoding allows the user to add additional fields for which Tableau will be able to generate latitude and longitude points. James Wright had a recent post on how Tableau’s geocoding works if you are interested in further detail.
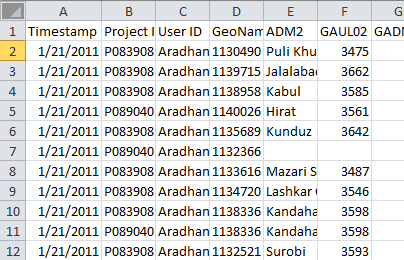
For my example today, I’ve downloaded a dataset from The World Bank with the latitude and longitude coordinates for many of their projects.
You can see what I’ve ended up with here:
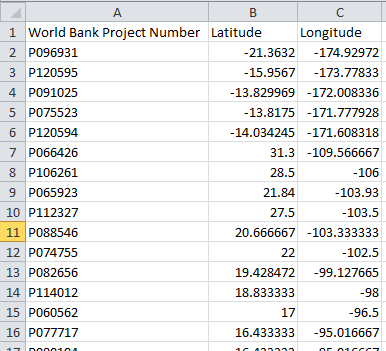
You’ll notice that there are only three columns. That is because these projects do not fall within a specific hierarchy already defined. You can read more about multiple column geocoding here.
A few more notes on your custom geocoding file:
- It must be in .csv
- Your geocode name will be the header in your A1 cell.
- Both your latitude and longitude columns must be spelled correctly and are case sensitive.
- All .csv files within that directory will be imported at once, so make sure you only have .csv files meant for custom geocoding in your directory.
Now that you have the full and correct excel file, you’ll need to do the actual import of the custom geocoding. Make sure you only have one instance of Tableau running.
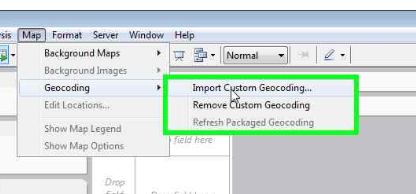
You do not need to be connected to a dataset, but you do need to be on your workspace in order to navigate to Map –> Geocoding –> Import Custom Geocoding.
You will promted to naviagte to the directory where your custom geocoding .csv file is located. You can see where I have naviagated below:
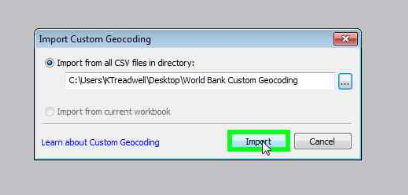
Once you choose to “Import” you will see that Tableau processes all .csv files within the given directory.
That’s it! You now have a custom geocode for all World Bank projects. Now, you can start working with any dataset which has the project number as a field.
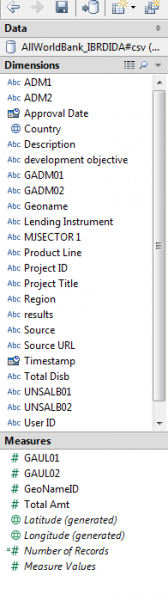
You can see my example dataset below. The column names do not have to match.
When I connect to the data source you can see that Tableau does not automatically recognize that “Project ID” is my custom geocode.
To assign it a geographic role, simply right click and navigate to Geographic Role –> World Bank Project Number. You can see name of the role is the same name as the field in A1 from my custom geocode .csv.
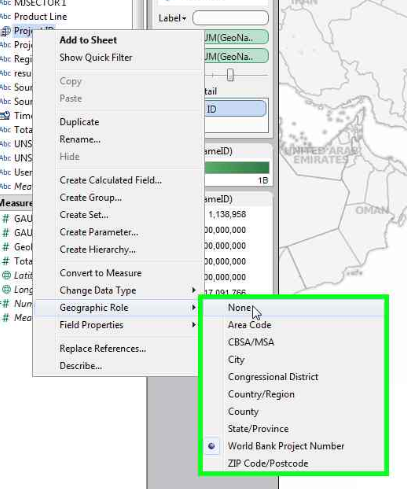
Now you can build any map you would like using just the Project ID!