Tableau provides many types of filter including range filters for dates and numerical data, but what of textual dimensions? For instance lets say we have a dimension with data in the following format, 3-digit months with a 2-digit year and a period used by the client to adjust the year end balance:
| Period | Sales |
| Jan-10 | 129 |
| Feb-10 | 185 |
| Mar-10 | 89 |
| Apr-10 | 124 |
| Adj-10 | 23 |
| May-10 | 156 |
This is a date based range of values, however the dates do not conform to any of the built-in date formats Tableau uses. The below visualisation demonstrates the result that we want:
So how do this work? The first requirement is Tableau version 6 as we are using parameters to select the start and end of the range.
Step 1) Download the data file and create a new workbook in Tableau connected to this data
Download from here Range Data
Step 2) Add two parameters to the sheet
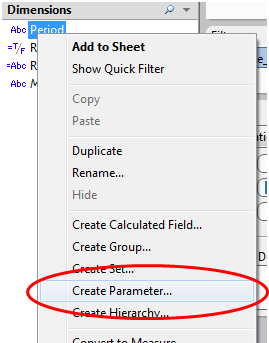
Right-click the dimension you want to provide a range filter on (in this case Period) and select Create Parameter. Call these “StartPeriod” and “EndPeriod”

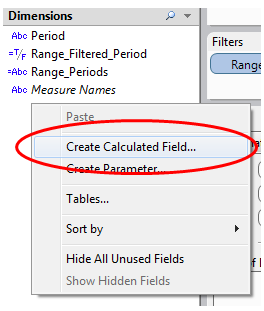
Step 3) Create a calculated field

This field is a string containing all of the values that the dimension will contain (this bit is the long-winded bit, and if your dimension data changes you need to update this field also.) In this example the string would read:
“Jan-10Feb-10Mar-10Apr-10Adj-10May-10Jun-10Jul-10Aug-10Sep-10Oct-10Nov-10Dec-10”
call the field “Range_Periods”.
Step 4) Add another calculated field
Call it “Range_Filtered_Period”. This generates the field we will use on the filter shelf. The syntax for this field is:
CONTAINS(MID([Range_Periods],FIND([Range_Periods],[StartPeriod]),ABS(FIND([Range_Periods],[EndPeriod])-FIND([Range_Periods],[StartPeriod]))+6),[Period])
This line of code searches the Range_Periods string (using the FIND function) for the [StartPeriod] selected, for instance “Feb-10” would return the number 6.
It then uses the FIND function again to find the [EndPeriod], e.g. “Adj-10” would return 24, we then add 6 (the length of each data item in the dimension) to this to find the end of the selected [EndPeriod].
We can then use these two numbers to remove all of the periods we don’t want from the [Range_Periods] string, to do this we use MID by providing the [Range_Periods] string and the two number from the FIND functions.
This gives us the string “Feb-10Mar-10Apr-10Adj-10”
Lastly we use CONTAINS, this function takes a string to search through, in this case our new [Range_Periods] string, and a substring to search for, our [Period] dimension.
Step 5) Add this new calculated field to the filter shelf

Add [Range_Filtered_Period] to the filter shelf and select “True” when the filter dialog box pops up.
Step 6) Have a play with the StartPeriod and EndPeriod parameters
See how it filters the visualisation.
Bonus point
The only issue with our current code is that it does not take into account that a user may select a [StartPeriod] that is later than the [EndPeriod], so edit the calculated field and replace the code with the below:
CONTAINS(
IF FIND([Range_Periods],[EndPeriod])>FIND([Range_Periods],[StartPeriod]) THEN
MID([Range_Periods],FIND([Range_Periods],[StartPeriod]),ABS(FIND([Range_Periods],[EndPeriod])-FIND([Range_Periods],[StartPeriod]))+6)
ELSE
MID([Range_Periods],FIND([Range_Periods],[EndPeriod]),ABS(FIND([Range_Periods],[EndPeriod])-FIND([Range_Periods],[StartPeriod]))+6)
END
,[Period])
This adds in logic to check for this situation.
Summary
This range filter works well on any data that is sequential, it could be date periods, letters in the alphabet or any string. You just have to ensure that the data is sequential and that there are no breaks or out of sequence data items. You also need to have a dimension field where the data items are all of the same length, in the above example 6 characters long.
Check back soon where I will be building in AND, OR, BETWEEN, NOT and other types of operators to this concept.

