
Ready to pick up where we left off? Last week, I posted “10 Ways to Drive End-User Adoption of Tableau – Part 1.” This week, I finish things off with Part 2. In this piece, I cover the remaining five ways in which you can bolster end-user adoption of Tableau.
Let’s get started.
Adapt Design to User Behavior
Snoop on Your Users.
Designing and building in a vacuum is a terrible idea. Iterative Tableau development needs to keep in mind the usage pattern of your consumers. Understand how they use your perfect dashboard; look at what they click on, which screens gets used, which screens get lots of clicks and which ones get ignored. Use that information to drive your design and focus your efforts where they’ll bear fruit.
There are good ways to do pieces of this with Tableau Server by creating custom views against the internal PostGres database. I do this with most clients. After all, there’s nothing like demonstrating value by proving users are using the dashboard every day! When we have the luxury of a CMS-based portal, we’re able to do quite a bit more using both the Tableau JavaScript API to track in-viz events and Google Analytics to track click paths and overall usage.
Snoop on your users. Use the information you find to improve the product. That perfect dashboard will evolve intelligently, and your users will thank you for it.
Support Parallel Consumption Modalities
Work for, not against, adoption.
Face it – the business worked before Tableau showed up (just not as well). Live, interactive visualizations are new, and your users need time to assimilate that new modality into their workflows. Nudge them towards the gold standard – live and interactive data conversation on Tableau Server – but work with them to start that process by integrating the new with the old.
PowerPoint, PDF, SharePoint, Paper! They’re here and we’re naively tempted to shun those systems. Don’t miss the opportunity to leverage these dinosaurs to introduce the New Data World. I routinely work with clients to build easy ways for users to export Tableau dashboards into PDFs or images. I can even dynamically compile key Tableau visualizations into PowerPoint format.
Users working with static copies of your perfect dashboard will walk away with more questions – and will go online to answer them. Look to the long game here: supporting existing business processes to speed up adoption and increase comfort.
Support Ownership of the Entire Process
Let them drive.
Build buy-in with your end users by giving them ownership of the tool. Imagine a world where your perfect dashboard is downstream of some changes made by a business user (think SalesForce), and they want some information on the Big Deal they just entered to show up in time for the Big Meeting this afternoon. The normal nightly refresh process isn’t soon enough, and they’d normally be out of luck. So, they call you. You run your magic to push the ETL, update the DB View and refresh the Tableau Extracts. You’re a magician!
Truth is, you’re a middle-man.
Eliminate the middle-man. Give your end users true self-determination, especially when working to create a seamless, portal-based environment. I often advocate for building a scripted process around TabCmd, PowerShell, Python or PhP that can trigger the logical data cascade described above. Sure, build some rules into the system to limit it to once per day or once every six hours (so it can’t explode), but allow users some measure of control.
Giving the end user a button that allows them to run this helps drive ownership of the product; all of a sudden you’ll start hearing “we” instead of “they.” As a consultant, the more I can impart this kind of thought leadership and remove myself from the day-to-day, the more my clients are able to leverage our skills to the maximum effect as well as develop internal processes to support the end state.
Make It Interesting
Give it a personal touch.
I have the privilege to work for clients of every size around the world. Users are very different across this set, but also very much the same. They all want to be stimulated, have their thoughts provoked and enjoy their day. Dashboard, Tableau and system design should help that cause rather than hinder it. I’ve found that a little goes a long way.
Little things like swapping the dashboard loading spinner can provide value and interest during a typically mundane moment. One example is swapping the spinner for contemporary product images that will give a glimpse into this season’s lineup. Another is a live stream of the companies’ Twitter feed. No matter what you choose to do, reducing latency and creating dashboards that perform well is vital. That said, a welcome distraction can just as easily take the user’s mind off of waiting.
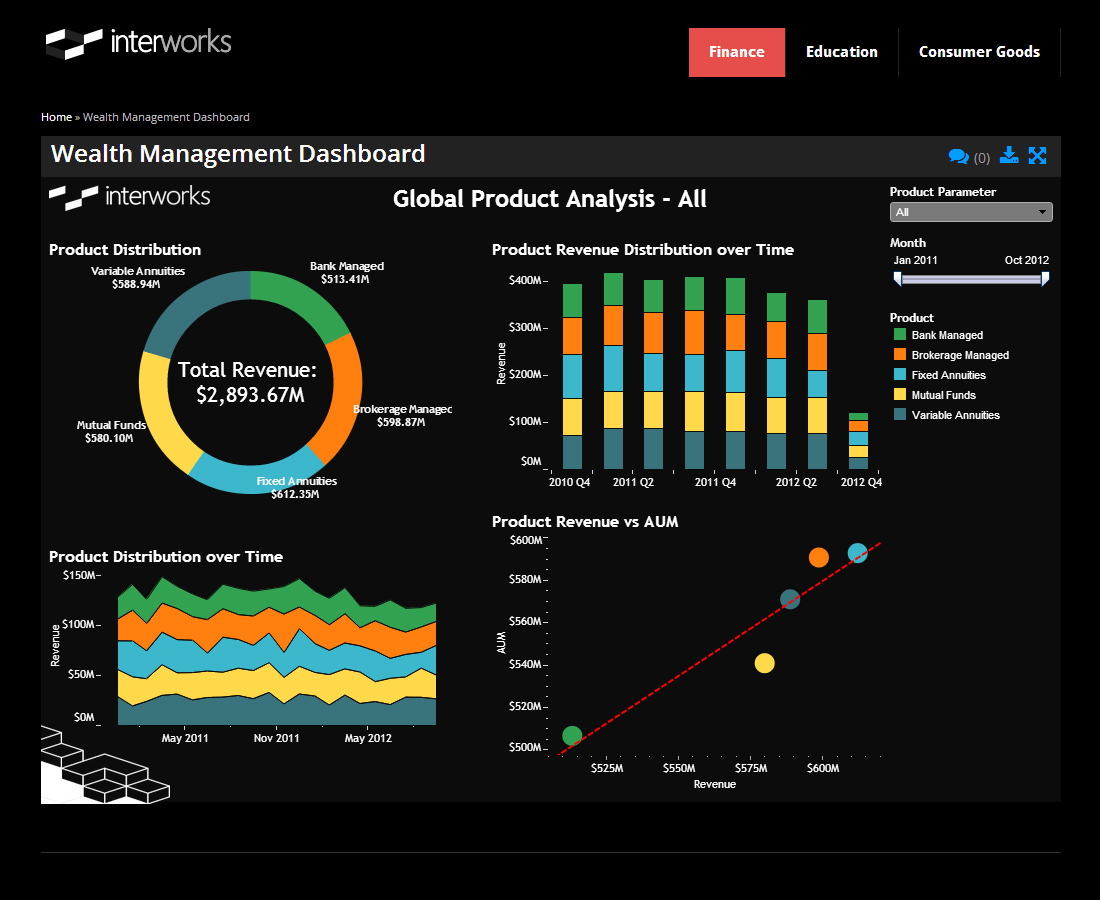
Above: An example of a branded Tableau dashboard hosted on a Drupal web portal.
Another method of adding interest is integrating Tableau into the corporate intranet – habituating users to seeing and interacting with visualizations on a regular basis. In some clients, I’ve even pushed highly-visual Tableau feeds to gigantic monitors around the building. Show something compelling at lunch and users will be all the more likely to use that perfect dashboard when it comes to meeting time.
Clearly Set Expectations and Define Scope
Don’t be afraid of what this isn’t.
Tableau, especially with your perfect dashboard leading the charge, is so much better than what pre-dated it. It often feels like magic. The experience is so empowering that users feel like the perfect dashboard can, and should, be able to do anything. Maybe it will eventually be able to, but unless you have some extra-special Tableau Kung Fu, your perfect dashboard won’t be able to do everything right away.
That’s completely fine and expected. Just be very clear with your users what you have designed the perfect dashboard to do. Show them the roadmap. Help them understand what it will eventually do and when/how you’ll be adding additional functionality. That way, you won’t have to explain to disappointed users that your lovely assistant didn’t actually get cut in half and have her torso re-attached. You’ll just have an audience excited for the second act.
Conclusion
How did I come up with this list? By making all these mistakes and many more over the last 12 years. I’ve built the perfect dashboard just to have it land on deaf ears. I’ve upgraded the perfect dashboard with the perfect update late one night, only to hear the screams of horror in the morning. My hope is that by nudging you all towards understanding and anticipating the interaction of people and data, you’ll be better prepared for success in Tableau.
This is a huge part of why I love working with the InterWorks team and our amazing consultancy. Yes, we’re able to push the technology envelope with innovative Tableau solutions and novel applications like Power Tools for Tableau, but those are means to an end. The real goal is to collaborate with our clients and drive change – to create a culture of enablement and enthusiasm around data-driven decision making.