
Some fun Table Calculation questions came in this week. With four hours in the air heading home to New York from Portland, OR, I thought I’d quickly add these to the learning library. Here’s the first – I’ll put up another post with the second, which is a great extension on our Calendar Blog Post.
My client wanted the ability to show reference lines averaging across two different levels of dimension on a single sheet. Here’s a good review of reference lines. The challenge here is that Tableau’s reference line options only give three default choices – Table, Pane, and Cell. Well, Pane worked well for one of these two reference lines, but the default settings were insufficient in this case to achieve the end result. So, here goes with a quick Table Calculation Solution! Be sure to review table calcs beforehand.
I built a dataset that will demonstrate the issue pretty easily. Fairly straight-forward; we’ve got Three levels of Dimension, and later on we’re going to try to figure out an average by Region and by State, only one of which will be possible by default.
|
Region |
State |
City |
Sales |
Inventory Units |
|
East |
NY |
NYC |
100000 |
2000 |
|
East |
NY |
Ithaca |
40000 |
4000 |
|
East |
NY |
New Paltz |
15000 |
3000 |
|
East |
NC |
Durham |
26000 |
2000 |
|
East |
NC |
Asheville |
35000 |
4000 |
|
East |
NC |
Brevard |
20000 |
2000 |
|
West |
UT |
Salt Lake City |
30000 |
4000 |
|
West |
UT |
Moab |
25000 |
3000 |
|
West |
OR |
Beaverton |
26000 |
2000 |
|
West |
OR |
Bend |
150000 |
4000 |
|
West |
OR |
Portland |
300000 |
2000 |
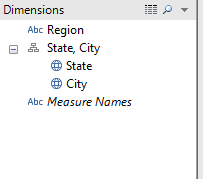
So, I connected to this Excel sheet in Tableau 8.0.2 and noticed a new behavior – notice that Tableau is now automatically adding a hierarchy for State/City. I’m not sure when this behavior surfaced, but I do like the suggestion; building hierarchies is a great way to organize data and makes it easy to build quickly in Tableau.
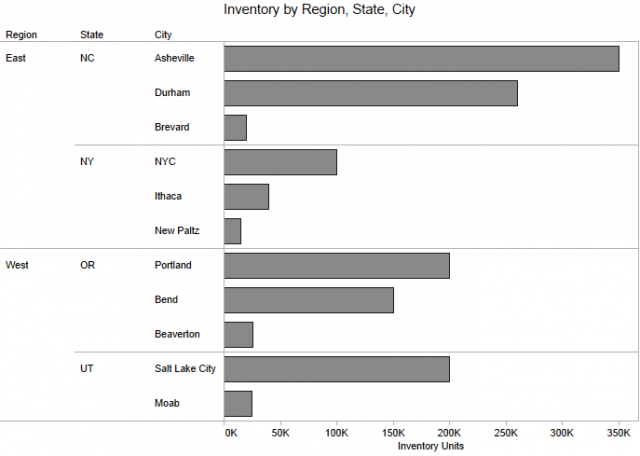
Anyway, I built a simple Bar chart to show Inventory by Region, State and City.
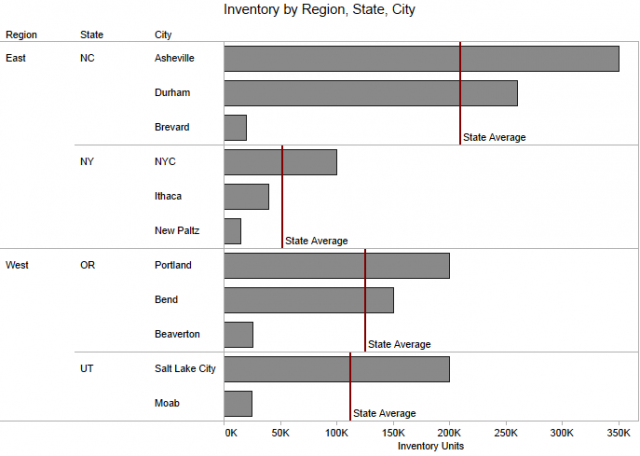
Then I added a simple Pane Average of Inventory, and we can see that Tableau calculates that at the lowest Pane possible, in this case at the State level.
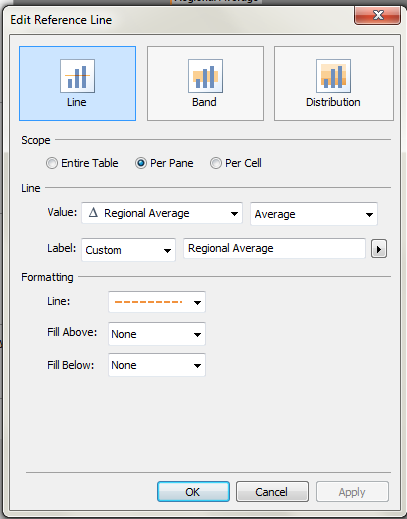
Here’s the Reference Line Dialog:
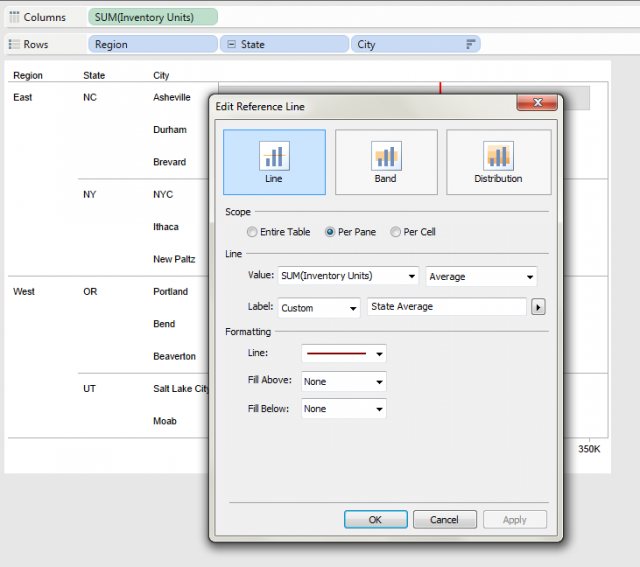
Ok, so far so good. Now I also want to create an average at the Region level. Unfortunately, I’m out of options on the scope – I’ve already used Pane and I don’t want to create a Table average.
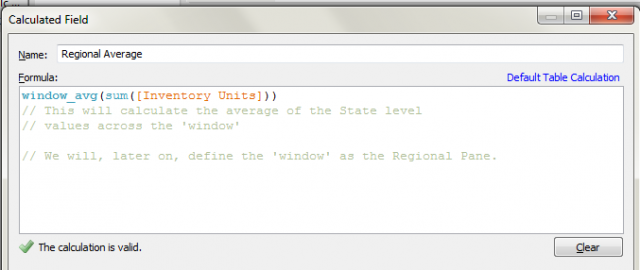
The solution is a Table Calculation, using the Window_Avg function. It’s important to remember that a Table Calculation is a Post-Aggregate function – which means that it occurs after Tableau has executed the SQL query to the Excel document, but before Tableau renders the view. The take-home message is that the Window_Avg function will take an average of the City level aggregations across the ‘window’ as we define it; it will not necessarily be the same as the SQL average if you aggregated at the Region level.
Anyway, this is the Table Calculation that I put together:
Then, we want to provide access to this Table Calculation in the View, so we drag it to the Detail Shelf, which calculates the values, but doesn’t necessarily do anything visual with the result set. We’re then going to have to adjust the Partitioning to fix the ‘Window’ to refer to Regions.
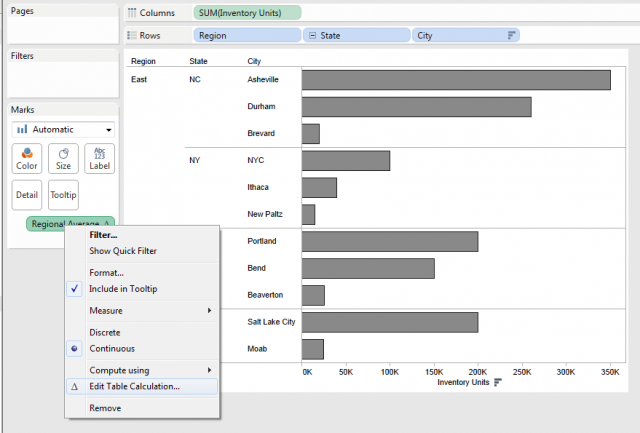
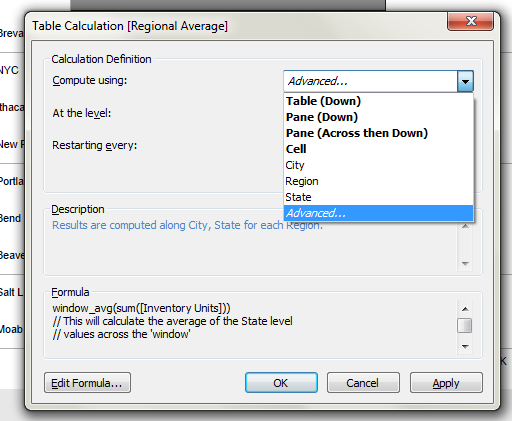
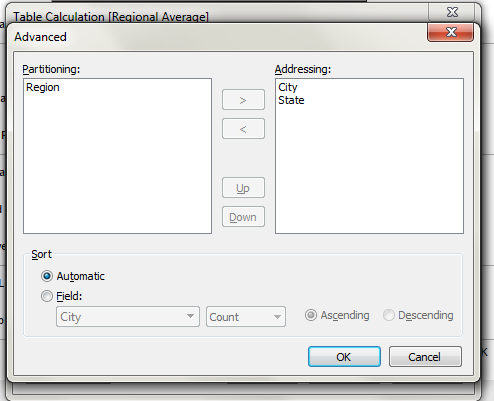
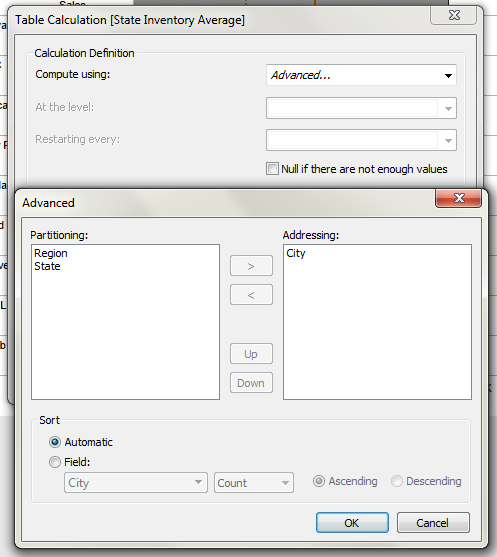
So, we’re going to Edit Table Calculation and change the Compute Using functionality to use the Advanced functionality since we want to take States and Cities into account, but not Regions.
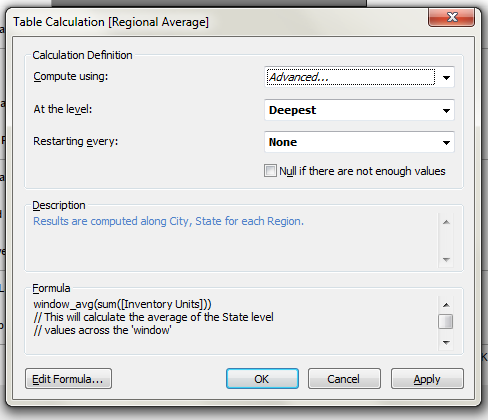
I’ll use the settings below, and since Sort isn’t important to the Avg context, I’ll keep the setting at Automatic. Then, when we say OK, since we’ve already set up the Addressing and Partitioning correctly, we’ll use the options here how they lay.
Now it’s just a matter of visualizing the data that we’ve just calculated; we’re going to add another Reference Line through the standard technique, using the PANE again – although what we’ve just done will define our own Pane rather than use Tableau’s default concept.
The result – notice that our Pane has now been redefined to describe the Region rather than the State.
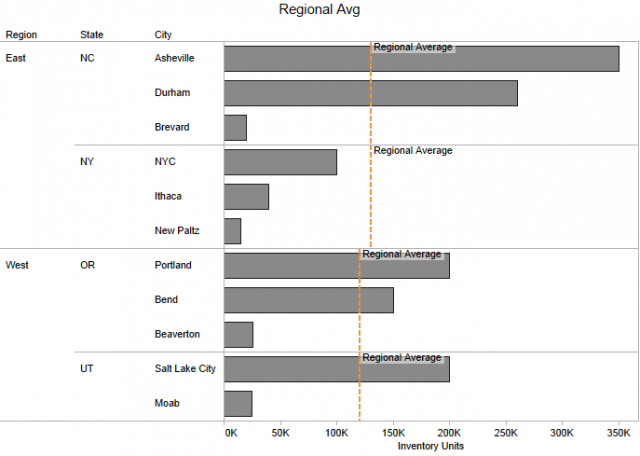
So, pulling the two together, we get a single sheet with both Reference Lines.
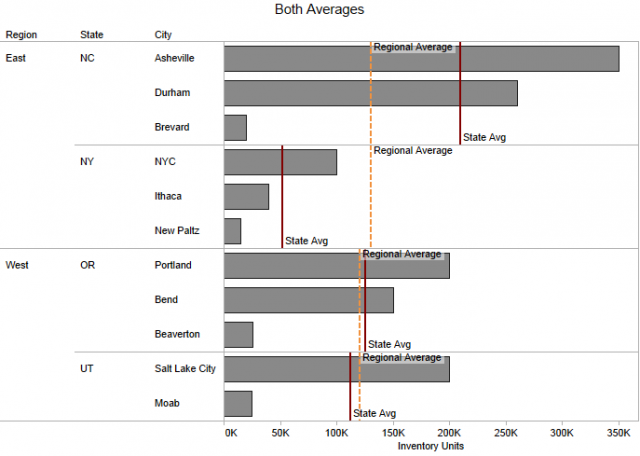
There! We’re done, right?
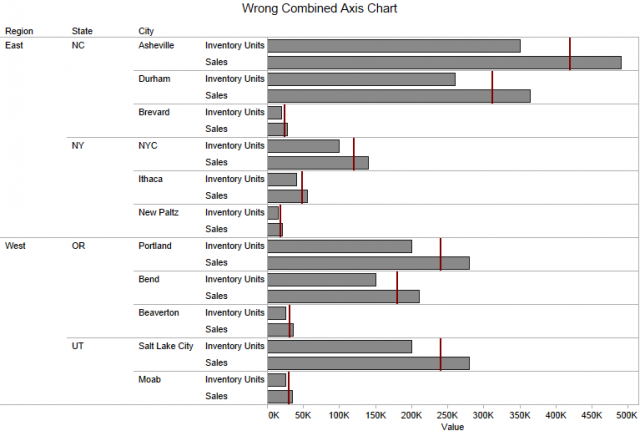
Well, sort of – there’s always a catch. The client then followed up that what they ACTUALLY wanted to do was show a combined axis chart where they not only do the above, but add on another measure, like Sales. Well, doing so (go ahead, try), will change Tableau’s default behavior to create a Pane average at the lowest level of Pane, which in my case is Measure names, so we get the average of the Sales and Inventory bars. Yuck.
Well, there is a solution here – it’s really an extension of the technique we’ve already used. We’re already set on the Regional Level for Inventory Units – we can do exactly the same thing we already did (which is add the field to the Detail shelf, set the addressing, and then add the Reference Line). So, we’ll need to build a similar field for the State Level – it’ll use the same formula, just different addressing.
Here’s what I used:
Alright! All done – I pushed this workbook up to Tableau Public, and you can download it from there or through the download link below. I added a few extra calculations including Deltas from those averages, which are potentially where you’ll want to go in terms of making this data actionable.
Also, here’s a picture of sunrise from Mount Hood’s summit last weekend because if you haven’t been recently, you should go ski mountaineering (or wine touring) in Oregon!