
Frequently in my training classes, a student will ask:
“I made a view that shows my percent of total sales, but when I apply a filter, the values change. Why is this happening?”
Today we’re going to examine what’s happening here and three ways to keep those percentages within your filters.
Problem Explained:
Below, I’m looking at my sales data over the course of several years. I have snapped a screen shot of only the top 10 (unfiltered).
Notice that for 2010, Joan Schaefer accounts for $21,484 in sales or .35%.
Top 10 Sales: Unfiltered
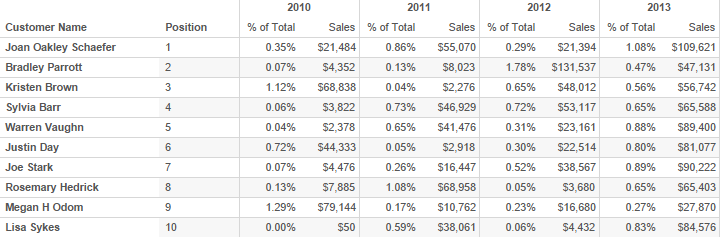
Since my % of total calculation is calculating over the records that are in my view, this number will change every time I adjust my filter.
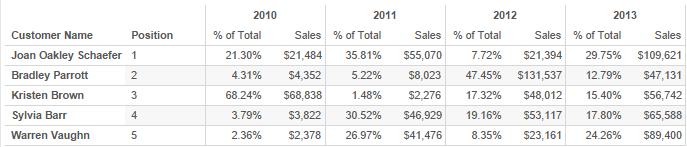
Here is the same view above, filtered to only the top 5 sales by customer. Notice that for 2010 Joan Schaefer NOW accounts for 21% of total sales.
Top 5 Sales: Filtered
Why Isn’t This Working?
The problem here is because of order of operations (remember PEMDAS?). Operations are processed in a predictable sequence. In this case, because top N filters process before table calculations in Tableau, the data is being filtered before the percent of total is being calculated.
We have two main options to fix this dilemma:
- Calculate our percent of total before our filter is processed
- Make our data look like its being filtered; hide data that would normally be filtered
3 Ways to Fix the Problem*
- Using a calculated field and a duplicated data source
- Using an IN/OUT set
- Using an index filter (index table calculation)
Method 1: Duplicating a Data Source
How it works: We will duplicate our primary data source and create a calculated field that presents our percent of total calculation in a part to whole format. We will be using the Sales field from our primary dataset as our numerator and the Sales field from our duplicated dataset as our denominator. This allows us to use our primary sales as the part and secondary sales as the whole. If we apply a filter, it will only filter the numerator.
Step 1: Right-click the data source and select duplicate (break any active links from primary to secondary).
Step 2: Build out your primary data source (based on the view above).
Step 3: Create a calculated field called % of Total: 1 SUM (primary [Sales]) / SUM (secondary [Sales]).
Step 4: Format the calculated field to show a percentage.
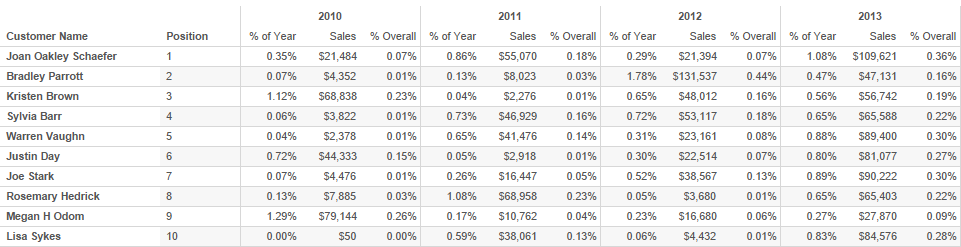
The view below shows both a % of Year calculation (via a table calculation) along with the % Overall (using our calculated field).
Points to Ponder:
This method may be less desirable on large data sets. Taking an extract and hiding fields that you won’t be using in your secondary data source may be a better approach when dealing with a larger data set.
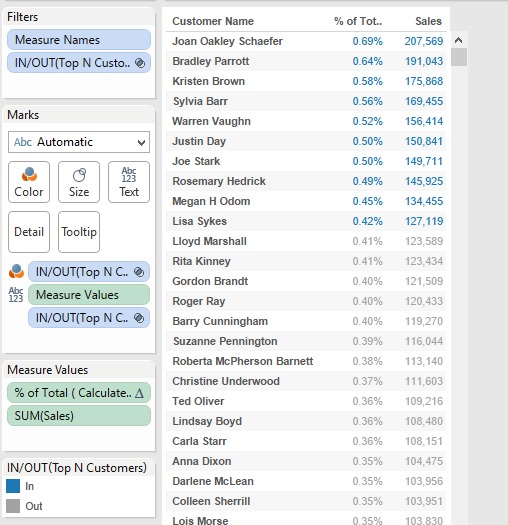
Method 2: Create an IN/OUT Set
How it works: The IN group of the IN/OUT set can be resized by the Top N filter. Simply hiding the values that are OUT will simulate a Top N filter and preserve your accurate percentages.
Step 1: Right-click your Customer Name dimension and select Create Set. Leave the defaults for General and Condition. Set the Top via the settings below:
![Edit Set [Top N Customers]](/wp-content/uploads/sites/default/files/TableauPercent4.png)
Step 2: Right-click the parameter and click Show to add it to your view.
Step 3: We will be using IN/OUT functionality, so if you’re using Excel or Access, you’ll need to take an extract (see: Working with Jet Data Engine Limitations).
Step 4: Put your IN/OUT Set on Filters and on detail set the filter to match values that = IN.
Step 5: Put another copy of IN/OUT on Color.
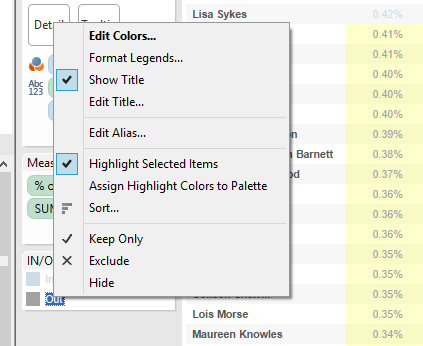
Step 6: From the color legend, right-click OUT and select HIDE.
NOTE: We are not filtering data here; filtering removes rows from the query, so the database returns less information. Tableau displays the values returned by the database. Hiding removes rows from the visualization despite the database returning far more information.
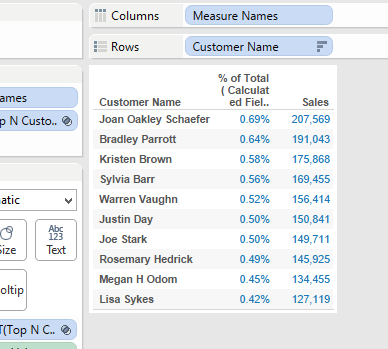
Your view will change from:
To:
Step 7: Format your view by removing the IN/OUT set from Color.
Points to Ponder:
Hidden Data. This can be a tricky solution because there is no filter being applied. If you are working with a large dataset, the entire amount will be returned and make for a slow query (much slower than our blend since that solution employs a filter). Inserting a comment that data is hidden or encouraging your coworkers to take advantage of CTRL+E (Worksheet -> Describe Sheet) will help to reveal the key components and inner workings of this solution.
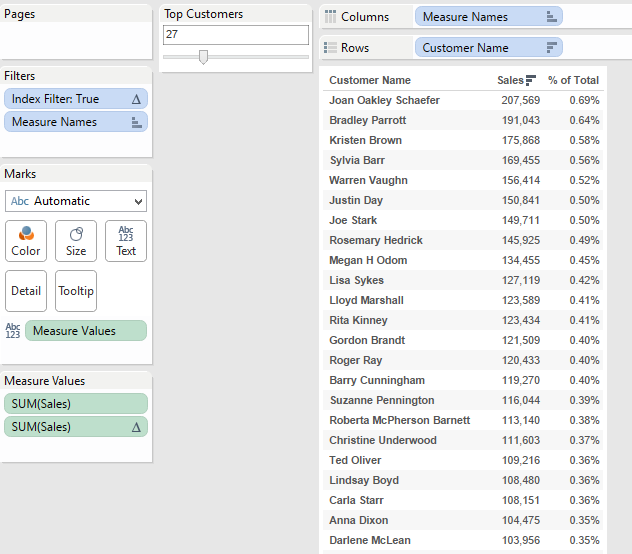
Method 3: Using an Index Filter
How it works: This check will ensure that your percent of total applies before the filter.
Step 1: Create a calculated field called index with the formula: index().
Step 2: Create a parameter for Top N.
Step 3: Create a second calculated field called index filter with the formula: [index] <= [Top N]. This will ensure that our data is filtered after the table calc occurs.
Step 4: Move the index filter field onto the filters shelf with the value TRUE.
Points to Ponder:
Table calcs can break. Our filter is being applied after Tableau has already run the database query, so we’re pulling everything into memory and doing less with the result. Be mindful that the index calculation is properly filtering out data. As always, checking your percentage calculations in a cross tab or within Excel is a great practice to ensure that your numbers are accurate.
*NOTE: Like many operations in Tableau, there are dozens of ways to achieve the same result. Today we only examined three common ways to handle this obstacle. Add comments below if you have used or devised a different method.