In the spirit of the season and inspired by Tiffany’s recent blog post (Design Efficiently in Tableau) listed below are three underutilized features of the Tableau 8.x families that will save you some time during design and analysis.
- Clipboard data source
- Tableau Status Bar, worksheet summary and worksheet description
- Fine tuning floating objects on your dashboard
CLIPBOARD DATA SOURCE:
Want to add some more dimensionality to your analysis? Missing some key sales or budget plan data? Take full advantage of Tableau’s rapid analysis capabilities by copying and pasting your comma separated or tablular data right into the software. Tableau creates a new data source that you can get vizzy with without having to create a data source manually. You can even grab tables right from the internet as long as the data is represented in a logical column and row format.
- Copy the data that you want to include in your workbook
Let’s add some sales targets for our friends in the SuperStore: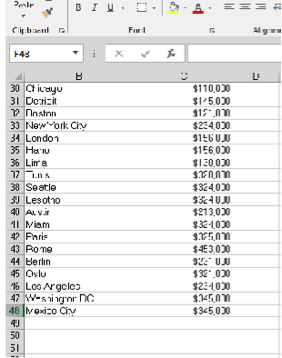
-
Return to your Tableau workbook and from the DATA select PASTE DATA
or Click on the Tableau view and press CTRL + V to paste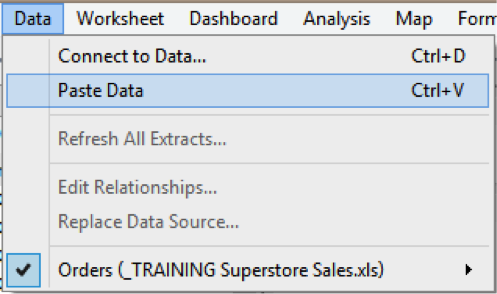
This adds a new clipboard connection
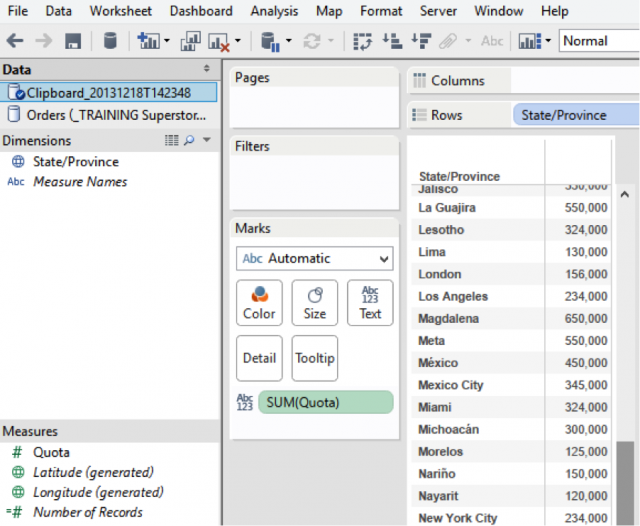
-
When you save your workbook, Tableau saves the data source as a .tab file
NOTE: The clipboard datasource is an ad hoc analysis tool. Functions that require greater accuracy (e.g. COUNTD or MEDIAN) may not be available unless you create an extract or you incorporate this data into a more robust data source. See the following Tableau KB articles for more information: article 1, article 2
TABLEAU STATUS BAR:
Trouble shooting table calcs or a calculated field? Need a quick way to determine what Tableau is actually doing to generate the current view? The Tableau displays the # of Marks, Rows and Columns that Tableau is using just below the data window. Just a quick glance can show if your analysis is on or off target.
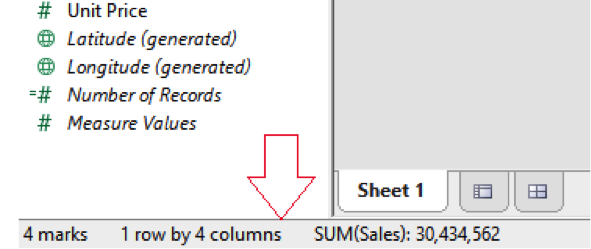
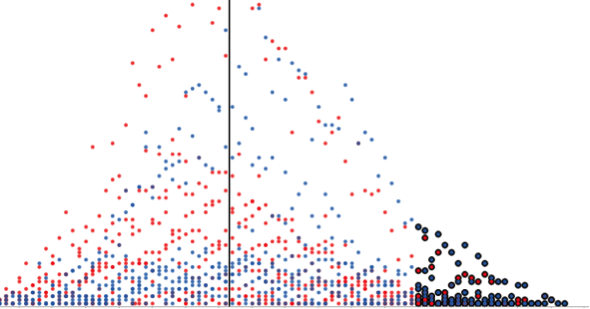
You can even narrow your focus on the status bar by selecting a small population from the dashboard.
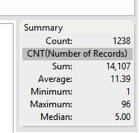
If you want to bring this detail into your view, from the Worksheet menu, select Show Summary to make the summary card visible. Here you can view the min, max, avg, standard deviation and other factors that help reveal your data’s story.
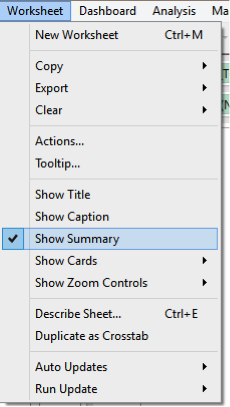
What if you need to provide a quick description of your worksheet? Or maybe you inherited this workbook and you need a 10,000 foot view of what you’re working with?
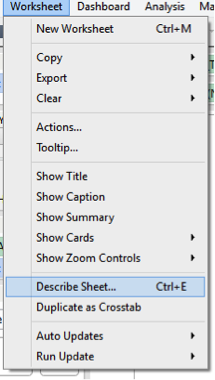
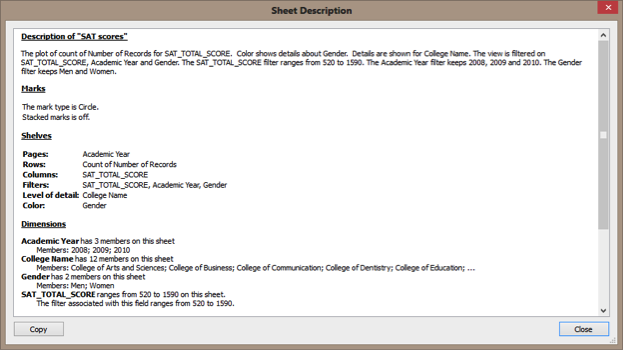
Select Describe Sheet (CTRL + E) from the Worksheet menu to produce a Sheet Description that lists: measures and dimensions used, filters applied, data sources, etc; all the raw details to speed up your documentation process.
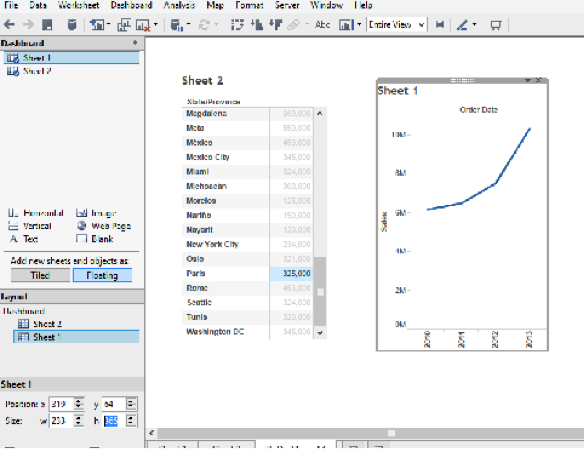
FINE TUNING FLOATING OBJECTS ON YOUR DASHBOARD:
Ever spent an hour trying to line up filters and other floating elements in your dashboards? Stop pulling your hair out and reorient them in a snap with this little trick:
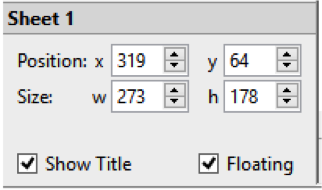
In the lower left hand corner of the screen in dashboard design mode is 4 key metrics that size and position your floating objects: X value Y value Size and Width. There are also up and down controls to move the object a pixel at a time.
If you have one or two objects and you want to line them up vertically or horizontally, just size one to the appropriate size, and copy the values to the other floating object. The second object will instantly adjust.
The same principle applies to lining up floating objects vertically or horizontally. In just a few seconds, the two sheets are proportional.
BEFORE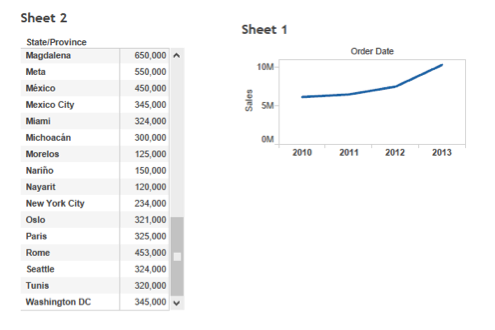
AFTER