Thanks for visiting the blog – if you are visiting here as a result of my Tableau European Customer Conference session, welcome along. The best way to keep up to date with new posts is via my twitter feed (@acotgreave).
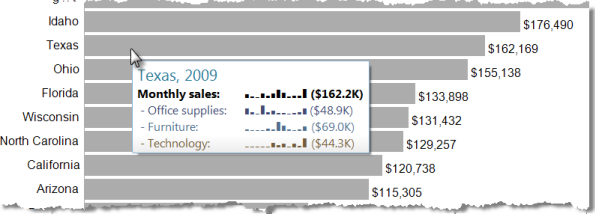
My session was all about tooltips, and ways you can use them to enhance your visualisation and make your audience’s lives a lot easier. I have posts on various tooltip topics:
- The time-series tooltip
- The bar-chart tooltip
- Multiple mark values inside a tooltip
- Conditional formatting
- A general good-practice guide to tooltips
If tooltips aren’t your thing, then have a browse of the blog for other Tableau tips and tricks.
At the time of writing, the conference workbook I used isn’t yet available for download. Follow me on twitter where I will update everyone when it is put onto the Tableau Conference website. There will also be a video recording of the session should you wish to revisit some of the specific content.

