
This blog came out of a desire to see which Canadian province is the “most Canadian.” After some extensive research into what metrics might quantify this (see below) and some searches for data, I settled on maple syrup production to at least get started. Who knows, maybe one day I will be able to fully quantify which province is the most Canadian, and you will see it happen right here on the InterWorks blog!

Side Note: If you have data on any of these quintessentially Canadian topics, send me an email!
One of the first issues here was the quantity and quality of the data. For Canada, only the new millennium has been captured and this is with varying units of data. For the US, there is a great amount of data, but it is not adjusted for inflation; this is one of my pet peeves with any monetary or economic data I encounter.
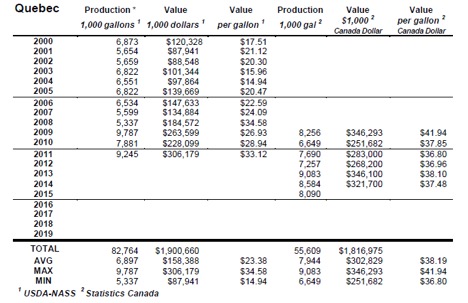
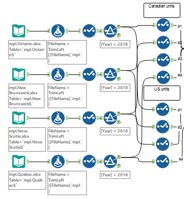
You can see below that there are overlaps and discrepancies in the Canadian data. In order to stretch out the data as much as possible, I made the decision to standardize the units used. After extracting this data with my trusty sidekick since college, pdftoexcel.com, there was plenty of work to be done in Alteryx:
My Alteryx work was done in a couple of stages:
- Separating the Statistics Canada and USDA data
- Adjusting the data for inflation and foreign exchange fluctuations, separately
- Bringing them back together
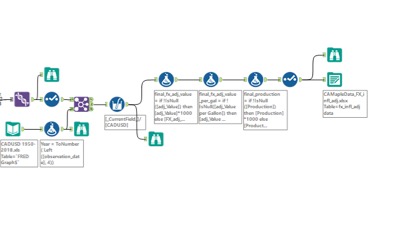
Separating the Data in Alteryx
From the table above, we can see that some data is from the US Department of Agriculture and some from Statistics Canada. In an effort to organize my workflow, I used Select tools to separate these two sets of variables into distinct areas of my flow, so I could make the necessary adjustments to each slice of data independently:
Adjusting for Inflation and Foreign Exchange Rate Fluctuations
This is the real meat of what we are doing, or should I say, the real sap. In the modern economy, money is always devaluing. Sometimes it is a hardly noticeable incentive to consume now and circulate money through the economy, and sometimes it gets completely out of hand—see Venezuela today. What we are concerned about in this dataset, which goes back 100 years, is that a dollar in today’s money is different than a dollar in 1919.
Governments have indexes that track the prices of bundles of goods across time, such as a bundle of basic foodstuffs. These Consumer Price Indexes (CPI) are not accurate, but they give us a good estimation of the scale of change. Anytime I need macroeconomic data like inflation index data, the first place I look is the St. Louis Federal Reserve Bank—not in the vault but in their online database, FRED.
Every country has a central bank that collects economic data that’s easily accessible, whether it is on the bank’s site or through a general-data portal managed by the government. Japan has Bank of Japan, the wizarding world has Gringotts, and Canada has Bank of Canada and Statistics Canada, which is where I found their inflation data.
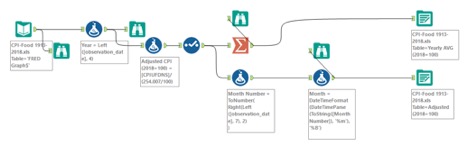
In a separate workflow, I adjusted the Consumer Price Index to set 2018 to the base value of 100 and aggregated monthly inflation data to the year level. To adjust inflation indexes to a new base year, we simply divide all index values by the ratio of the index value in the desired year to 100:
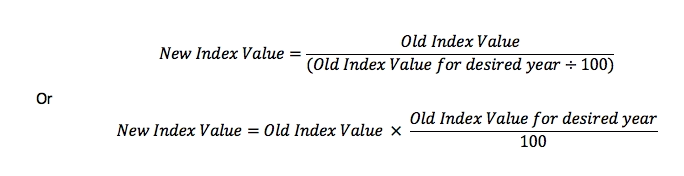
To adjust the dollar values themselves, we can multiply the values by (100/CPI):
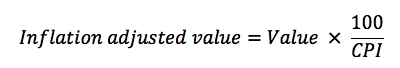
So for 2018, which has the CPI value of 100, the multiplying coefficient is 1, (100/100). In 2006, our CPI value in the US is 66, so a price of $40 in 2006 would be 40*(100/66), or $60 now. Remember, this is an estimate.
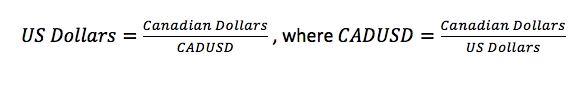
To adjust Canada’s dollar amounts into US dollars, we can take the Canadian dollar value divided by the CADUSD rate, Canadian dollars per US dollar:
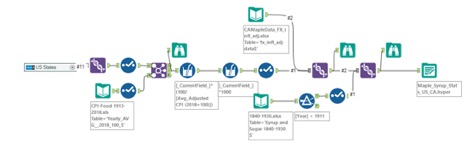
Bringing the Datasets Together
After some more cleaning, I unioned the Canadian data with the US data and was ready to go:
Satisfy your sweet tooth and check out the history of maple products in the US and Canada below!