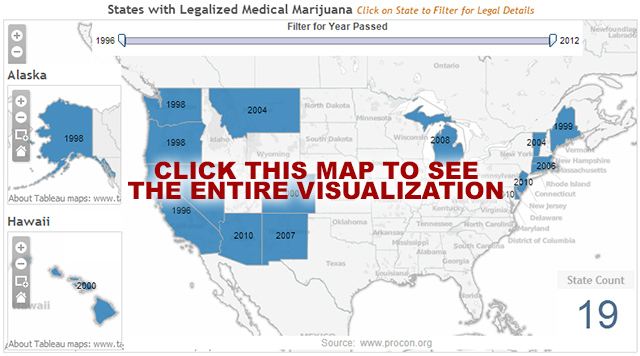
I saw an interesting post and data set this morning from ProCon.org. The information was in tabular form, so I copied it and extracted the data into Tableau. 20 minutes later, I had a fully-interactive dashboard that presented the information relevant to me in a map. The map displays the year medical marijuana was legalized in each state. The filter allows you to see which states were early or late adopters. The dashboard includes three maps, one crosstab and one URL object. The URL action allows you to display the relevant legal details from the ProCon.org website.


