
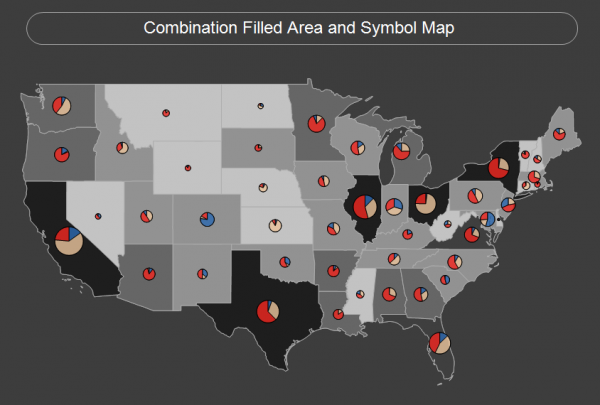
Last week, a client in Washington D.C. (and several clients before) have asked me about building combination maps that combine the new filled map style with the symbol map.
This is not a Show Me option but is pretty easy to do once you understand the technique. We will be using the Superstore Sales Excel file that comes with your Desktop Pro version of Tableau Software.
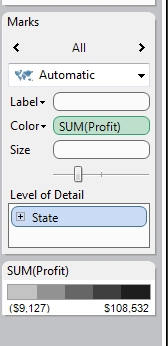
Step 1: Create a fill map by selecting State and Profit from the dimensions and measures shelves. Then click show me and select the filled map type.
Optional: I decided to alter the color scheme of the fill map by clicking on the upper right-hand region of the color legend and searching for a muted color pallet. I selected grey and clicked-on the stepped color range with 5 bands. This will mute the background map a bit and make the symbols easier to see clearly.
I also went to the map options and selected the Dark map background type – then unchecked all the standard map layers that normally include base, land cover, light country borders and light state borders. I did this because I want only the USA Map to appear in the view.
Then go to the marks shelf and clicked the little down arrow next to the Color control and changed transparency to 100%. This makes the state outlines easier to see and the colors a little darker.
Step 2: Drag a second copy of Latitude (generated) from the measures shelf to the row shelf. Then drag a second copy of Longitude (generated) from the measures shelf to the column shelf.
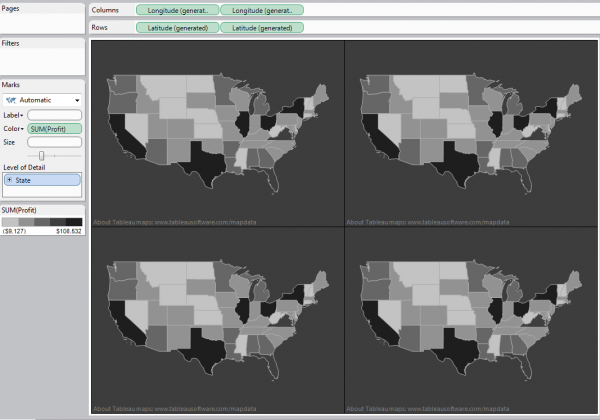
Your map will look like (4) smaller maps now because we have two axis being displayed for X & Y axis.
Step 3: Right click on the second Longitude and Latitude pills on the Column and Row shelves and select Dual Axis. This will create a dual axis chart. One axis supports the filled map. The second axis will provide the control over the symbol map that we will create in the next step.
Step 4: Create the symbol map by altering the mark type for the first Longitude and Latitude pills. This is enabled by going to the marks shelf and clicking the small down-arrow that appears when you hover over the title section of the marks card shelf. Enable the Multiple Mark Types control.
Step 5: Use the axis scroll area that should look like this now:
Once the axis scrolling tool is enabled you can now style the mark type for the axis that will contain the symbol maps.
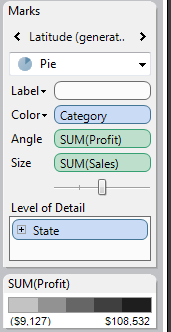
Step 6: Click the Marks scroll bar to the right one click by pointing at the > symbol to the right of ALL so that you are now displaying the Latitude (generated) mark control.
Then, change the mark type from Automatic to Pie by clicking the down arrow and clicking on the pie chart mark type.
Step 7: Drop Category on the color shelf, Profit to the angle shelf and sales to the size shelf in the marks shelf area. When you finish that your marks shelf should look like this:
Step 8: You probably don’t see any pies yet. That’s because the filled map marks are covering them. Uncover them by going to the Columns shelf and dragging the first Longitude pill to the right of the second one. Do the same to the first latitude pill on the rows shelf.
After that your pies should be visible. You have now built a combination Filled Area and Symbol Map.
Optional styling of Pie Symbols
- Drag your size slider right below the Size – SUM (Sales) shelf in the marks card shelf area to the seond vertical grey mark. This will increase the size of the pies to the largest size the map will display without overlapping the marks excessively.
- Change the colors used to color the pie slices to a brighter color scheme. This will make them stand out even more against the grey filled map background. You do this by hovering over teh title area of the color legend to expose the small down arrow on the right. Click that down arrow and select the Edit Color option. Then select a color pallet with brighter colors by clicking the down arrow to the right of the word Automatic. I picked blue-red 12. Click the assign pallet button, then OK.
- Style the pie edges by clicking the little down arrow to the right of the Color in the marks shelf. You can increase or decrease transparency and add boarders. I added black boarder lines to make the pies edges more clearly seen.
- Annotate the map with a title by pointing at the area of the map you want to annotate, right-clicking – then selecting the area annotate type. When that annotation is created you’ll need to click inside the annotation box and pull the edges to position it precisely. You can also right-click and edit the text. I changed my text to white.
Finally I edited the surrounding title boarder to make it white and very rounded by right-clicking in the annotation box, clicking format and making the appropriate selections in the format shelf at the upper left section of the screen.
When finished your map should look something like the picture at the beginning of this post. Watch the video for a real-time walk-through of the procedure.
I hope you find this blog post and the accompanying demonstration video helpful.
Be sure to view Part 2 of this demonatration to further explore region specific displays.