
Working on the InterWorks Expert Hotline I come into contact with many clients every day assisting them with all aspects of their Tableau deployment from data preparation to best practice dashboard design all the way through to complex table calculations and Tableau Server tuning. This new series of blogs will pick up hot topics that are commonly seen during hotline bookings and share that knowledge with our wider customer base. This blog will look at best practices for data connections. Having a strong foundation is instrumental to the success of any development project and developing BI solutions in Tableau is no exception to this. A common issue with Tableau deployments is performance degradation manifested in poor data connection design. This blog will take a look at a 12 step set of best practices that will ensure that all data connections are initially set up for optimum development speed and then configured for best possible performance when the report is ready for production use. To help look at the potential for performance issues I have created a ‘big’ view against the Microsoft SQL Server AdventureWorks2014 database. This view has 100 columns and 12.4 million rows. This is not enormous compared to some of the databases that we experience in the real world setting, however the performance gains that are demonstrated will scale against larger databases and deliver significant gain to both the Tableau developers and the audience. I have connected Tableau to this view without performing any data maintenance and then created an extract. I have then produced a straightforward dashboard showing some sales data. 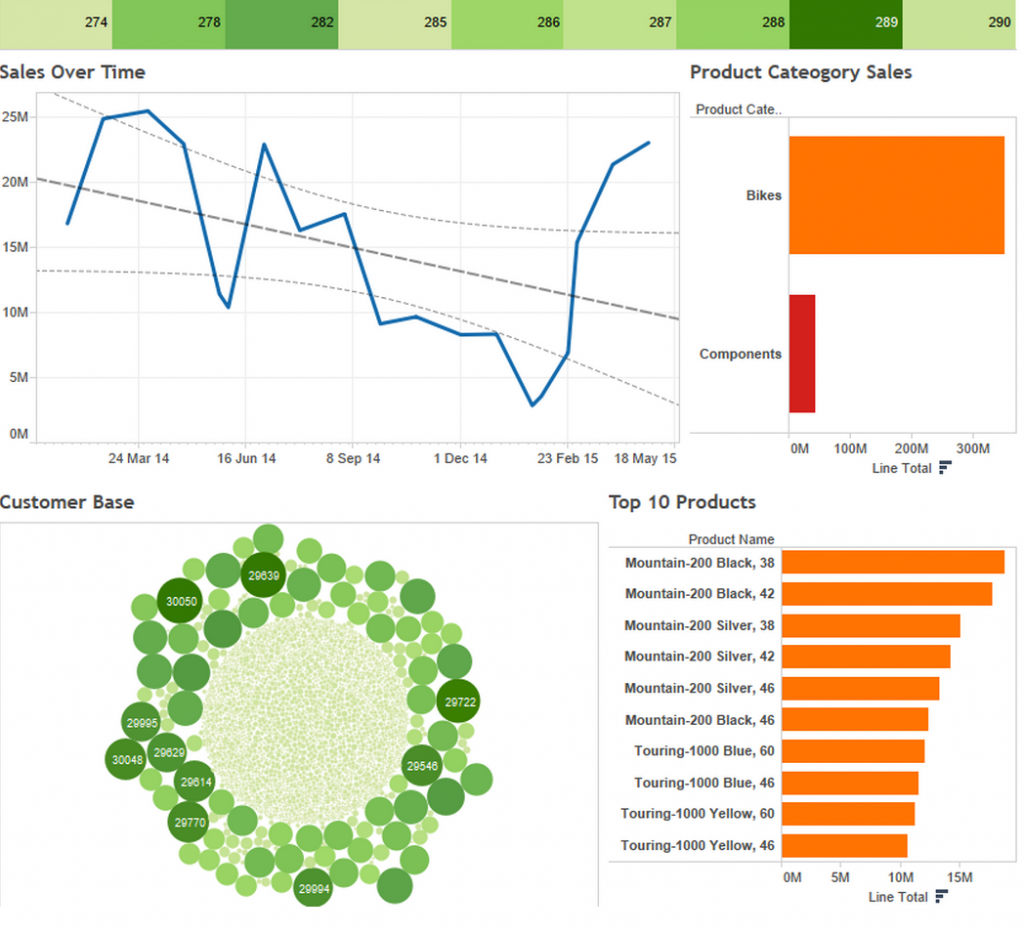
Using the Workbook Tools Performance Monitoring I have then carried out a set of actions and filters against the dashboard and recorded the execution times in seconds for these which are shown below:  The Workbook tools are a component of the Power Tools for Tableau suite of applications that allow for analysis and automated changes to be made to Tableau Workbooks and Server files. These tools can save you many hours on the administration of your Tableau environment. For more information see https://interworks.co.uk/business-intelligence/tableau-tools/ The final test I carried out was the record the time taken to build the extract which came in at a 2508 seconds or a little over 41 minutes. I will now run through my 12 steps for best practice data connection development. During this I will produce two additional data connections; an optimised development data connection and a production data connection. I will then carry out the same benchmark tests as before and compare the timings. 12 Steps for Data Connection Development These are the 12 steps that I follow each time I start out on a development project in Tableau. These steps ensure that at whatever stage the dashboards are at in terms of development they are as responsive as possible. 1 Build the data connection The first stage is the initial connection to the underlying data source. In this case the data connection is a SQL Server view (see attached SQL File). The file is made up of 75 Dimensions and 25 measures and has 12.5 million rows of data. 2 Review all fields Review all the fields in the data connection and ensure that they are set correctly to either Dimension or Measure and have the correct data types applied.
 3 Hide all non applicable fields This is an important early step. You need to identify all the fields in your data connection that you will never use during analysis. There will be i) some fields that will definitely be required, and ii) a selection of fields which may be considered during the build but you are unsure about, and iii) the fields that will never be used. These are the fields that should be removed at this stage. For this step you can use the main data connection editor window or the meta data manager screen. However I find it is easier to go to a blank worksheet and multi select (ctrl click) all the fields not required from the dimensions and measures shelf, you can then right-click and hide these fields.

The time at which fields are hidden makes a big difference in Tableau. If you hide fields in a connection with an active data extract the field is only hidden from you in Tableau Desktop. If you hide them before you extract, Tableau will remove them from the query that it uses to pull the data and it will not be pulled in at all. This results in fewer columns in the query and the resulting extract meaning a faster extract speed and better performance as a result. 4 Apply Long Term Filters When you click to generate the extract you can apply filters. This limits the data brought into the extract. Some filters will be long term (permanent) filters. For example if you are only producing this report for a rolling 2 years then a filter can be applied to remove all other data. The same is true if the report is only for specific locale or business division as the non applicable data can be removed permanently. All of these will limit the row count and provide performance benefit.

5 Apply Short Term Filters These are filters applied only for development. For example If I limit the development report to only two products or the top 100 products out of a possible xxx and also only include 2 months per year this will allow me to pull in a dramatically smaller dataset making extract creation quicker and giving the me maximum speed during development. I will quite often only produce reports on a small subset of data, 1 week for example, to give me this speed during development and also give me a subset of data to get signed off as accurate. In this example I am limiting the data to the first 2 days of each month only 6 Build Development Extract I can now run the extract build. With reduced rows and columns I would expect this to be quicker. And it has – 89 seconds compared to 2508 seconds. This is considerable when scaled against larger datasets. 7 Build The Dashboards Now I can go ahead and build my dashboards against this development set.

At this point I now have a signed off dashboard sitting on a development data connection and it is time to build a Production Data Connection. 8 Remove the Extract I start by removing my development extract. Navigate to a blank sheet so that Tableau does not try to process live data, right click on the data connection and delete the extract. 9 Hide all unused fields Next up I can use the hide unused fields option. Click on the menu on the dimensions shelf and choose the hide unused fields option.

As it says on the tin this option will look for all dimensions and measures not being used anywhere in the workbook and hide them. This will have a dramatic effect on the speed of the extract as it is reducing the column size considerably. Based on my dashboard design I would be left with just 8 fields from the underlying dataset. A massive reduction from the 100 columns in the initial view. 10 Remove development filters and apply new long term filters I now need to review my filters removing any filters applied only for development. I also may have determined new long term filters that can be applied. 11 Extract Data I am now in the position to extract the data and build my production dataset. An extra step I would consider here is to aggregate visible dimensions. What this option does is truncate all date fields to a fixed level (for example year or month) and then sums up all measure fields grouping by the remaining dimensions. For example AdventureWorks has all dates at day level, in this dataset if a product was sold every day in January 2015 then there would be a row of data for this product on every day in January 2015 with a sales value. What aggregate visible dimensions would do is return a single line for the whole month (no days) along with the product ID and the total sales amount for all days. For a single product in a single month this would save 30 rows in our dataset. Spread out across the whole view this could be a considerable time saver for the end user. One thing to bear in mind is that using this will remove the dates from the dataset restricting the analysis that could take place which is why I suggest it as a final enhancement if your time series is all at a high date level (i.e month). The extract will also be slower to generate as the query required to fetch the data will be more complex. Using aggregate visible dimensions against my production dataset to return all dates at month level reduced the row count from 7,444,201 rows to 2,183,256. If all my time series analysis was only required at month level this would be an excellent design choice for end user experience. For the purpose of this blog I chose not to aggregate the dimensions as I wanted to compare the original dataset to an optimised dataset at day level. As I am now pulling all the rows of data into the extract but a significantly reduced column count. This resulted in a 321 second extract time, more than the development data source but a lot less than than the initial data connection. 12 Optimize Extract Once the data has been extracted I can now run an optimisation by clicking on the option contained within the data menu and the extract sub menu. This will create a secondary structure inside the actual extract file materialising the results of some calculated fields and also creating views for the filters to query so that they do not have to run against the whole dataset. The Results To demonstrate the advantages of efficient data connections I carried out a set of benchmark tests on each workbook I created. Extract Refresh times Each workbook was uploaded to Server and the extract refresh time recorded.
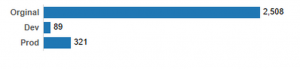
This makes it pretty clear that amending the data connection reduced extract refresh time considerably. The best extract refresh time was for Development running at just under 1.5 minutes compared to the 42 minutes the original workbook took to refresh. This quick extract time would be of great benefit during a development cycle as changes can be made to the data connection without the need to wait for the extract to fully rebuild. The production connection extracting in 321 seconds saw an improvement of over 35 minutes when compared with the original despite containing the same number of rows. As I did not apply any additional data filters this is purely down to the removal of most of the columns during the production data set build. Benchmark Testing The Workbook Tools for Tableau have a tool called Performance Analyzer. This tool opens a Tableau workbook and records timings for all processing carried out by Tableau including the load time for opening the workbook, all interactions and filter applications. 
In order to assess the benefit of the data connection best pracrice steps I drew up a list of benchmark tests and carried out the same tests on the original, development and production workbooks. Here is a summary of the results.

The results show exactly what I anticipated. The best results are for the development dataset which contained a very small number of rows and a reduced column count. The Production dataset has significant performance improvement over the original data connection also. Here are two key benchmark areas in more detail:

The load time when opening the Tableau Workbook file is dramatically reduced for the Production workbook when compared to the original workbook loading an impressive 61% faster.

Grouping all the action filter benchmark tests and computing the average also shows that there is also a significant performance gain here -16% on execution time over the original workbook. I hope that this blog has been useful. Good data connection design has a positive impact on the developer as the time to execute tasks and make data-connection changes can be considerable. Taking the time to create a development data connection makes for fast intuitive data discovery. Once the report is finalised removing all non-required columns and rows will provide the audience with the best possible user experience. Here is a cheat list for the 12 Best Practice Steps: Build Development Data Connection 1 Build the data connection 2 Review all fields 3 Hide all non applicable fields 4 Apply Long Term Filters 5 Apply Short Term Filters 6 Build the Development Extract 7 Build Dashboards Build Production Data Connection 8 Remove the Extract 9 Hide all unused fields 10 Remove development filters and add any new long term filters 11 Extract Data 12 Optimise Extract All performance monitoring for this blog was carried out using Power Tools for Tableau. The tools can significantly improve maintaining your BI environment and are available on a full featured trial license. https://interworks.co.uk/business-intelligence/tableau-tools/