(Note: This post is an expanded version of an article I originally posted on the Tableau Community Forums prior to joining InterWorks.)
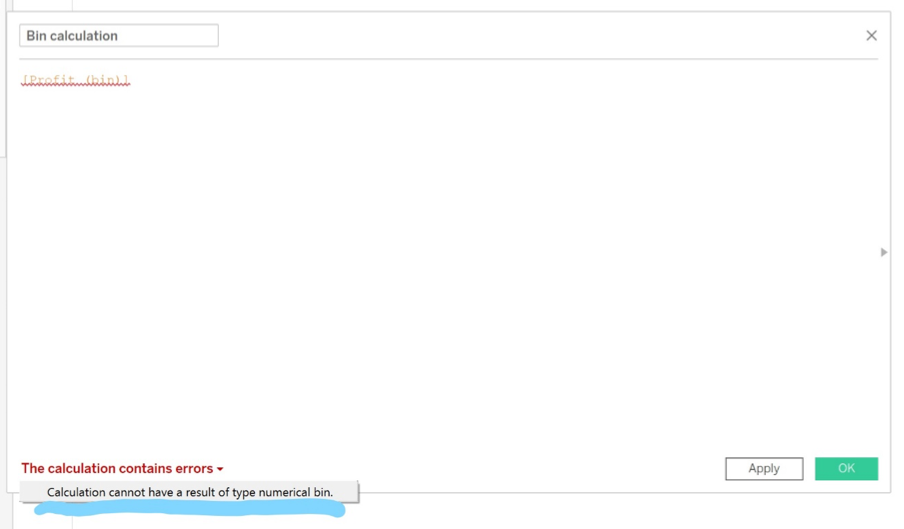
Tableau has the awesome capability to build bins and instantly create histograms, but it comes with a couple limitations. First, bins are not available for use in calculations. It turns out, Tableau has a specific data type for bins called numerical bins. These bins throw fun errors when you try to use them in a calculation, such as the error below:
Second, and more frustrating, you cannot group the bins. In many other visualizations (scatter plots, bar charts, etc.), grouping elements is as easy as selecting the marks you want to group and selecting the Group option. When selecting bins on a histogram, you can create sets but not groups. The lack of functionality often surprises clients.
An Alternative Way
In this blog post, I’ll be showing an alternative technique that, while you still can’t group, builds the final view a grouping would have created. It involves using a calculated field to replicate the bin functionality, then building two dynamic sets for your upper and lower limits, all while tying these to parameters to provide flexibility.
To start, I’ll be using Tableau Desktop and its sample Superstore data source. This data source contains not only very clean data, which is useful when testing out new chart types, but also a few built-in fields. This includes a field called Profit (bin) that saves us a few clicks. For reference, I’ll start by dragging Profit (bin) to the Columns shelf, followed by CNT(Profit) to the Rows shelf and Label menu on the Marks card to build a standard Tableau histogram:
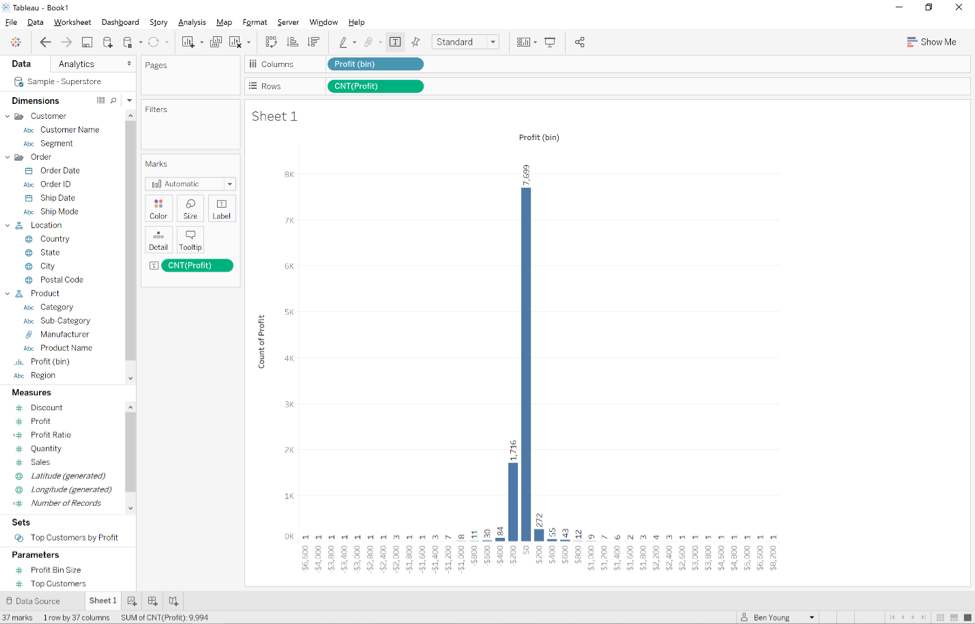
The view above needs additional work for many reasons, but it also perfectly highlights a potential issue with histograms. The extreme edges of the data cause the view to stretch and zoom out for relatively few marks. With CNT(Profit) on the Label menu, we can see values on the tails, but they are drowned out by the high count of occurrences grouped around zero. Grouping these bins provides one method for dealing with these extreme values.
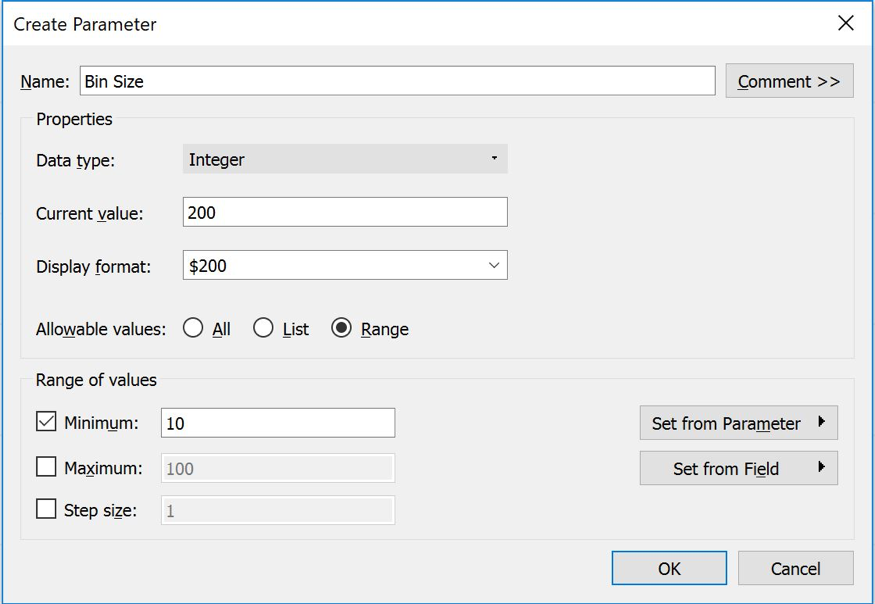
The first step to setting up our alternative view is to manually create the bins. To do this, I’ll first create a parameter to drive the size of the bins in the view. I find it helpful to include flexibility from the beginning rather than having to go back in and add it later. I’ll call this parameter “Bin Size,” make it an Integer Data Type, give it a current value of $200 with a custom currency format and a range of values that force the value to be at least 10 (negative or zero bin sizes would break things):
With Bin Size available, I’ll use a formula to create the manual bins. You can call it whatever you’d like. In my case, I called it “Custom Bins:”
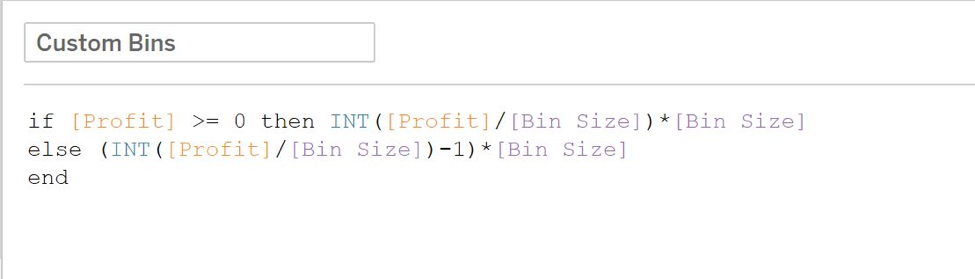
This calculation may look familiar to those coming from an Excel environment. It works by using the INT function to truncate the decimal point of the returned value. Multiplying by Bin Size again will create the relative bins by returning values that will all match due to the truncation. Things get a little tricky when dealing with negative values.
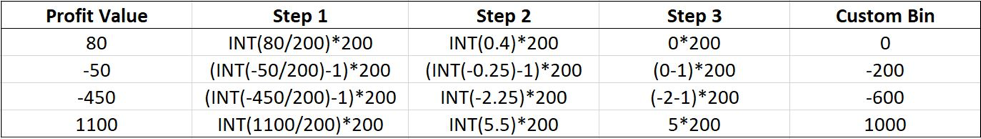
You need to subtract one to account for the fact that using the INT function on a negative number acts as a ROUNDDOWN (rounds towards zero) rather than the required ROUNDUP (rounds away from zero) for creating histogram bins. To illustrate, using our default Bin Size of 200, here’s a table building out the calculation logic Tableau is performing on the record level:
Note: Dragging Custom Bins to the Columns shelf, changing it to Discrete and placing CNT(Profit) on the Rows shelf will recreate the original view using the generated Profit (bin).
With the bins now ready, the next step is to build two parameters called “Group everything above” and “Group everything below” and tie them to Sets to mimic grouping. With these parameters, the user will be able to choose what level they want to group at. This will provide flexibility for the final view. These will be set up like the Bin Size parameter, just with no range specification:
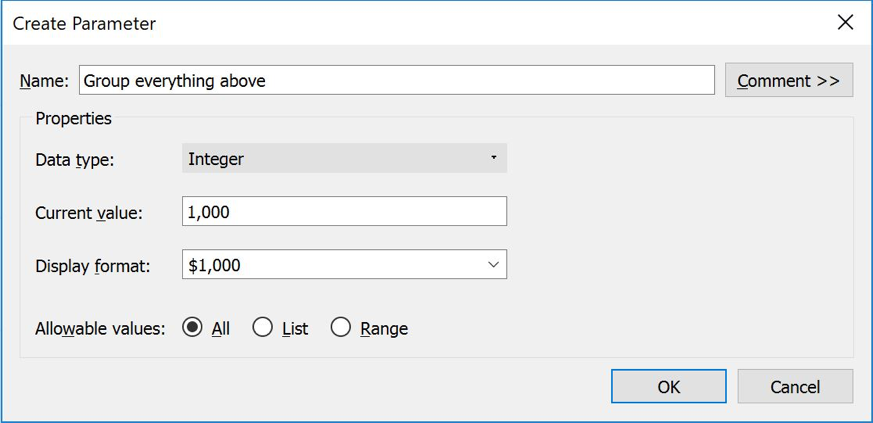
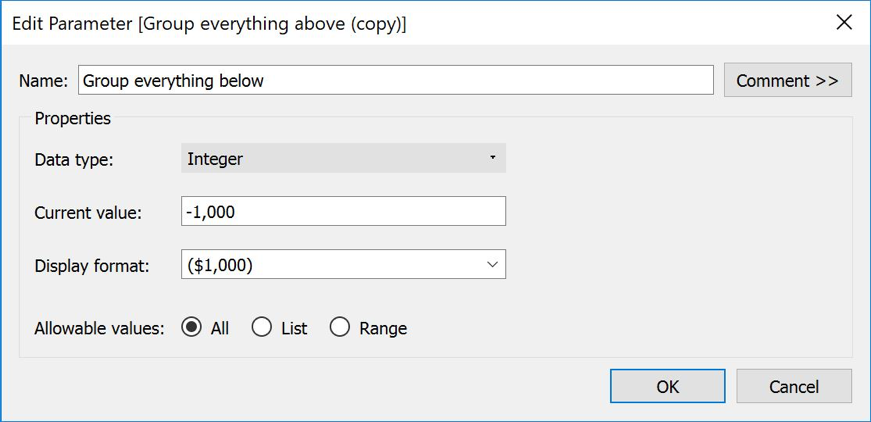
Save yourself a few clicks by duplicating Group everything above and editing it:
I want to build the sets based on profit, however, profit is a measure and you can’t create sets from measures. First, I need to duplicate the field and convert the duplicated field into a dimension and rename it “Profit – Dimension.” I can then use this new field to create the two sets we need: upper limit and lower limit.
When creating the two sets, I’ll have them dynamically update based on our parameters we just created. The first set I’ll call “Upper Limit” and I’ll tie it to Group everything above under the Condition tab as shown in the screenshot below:
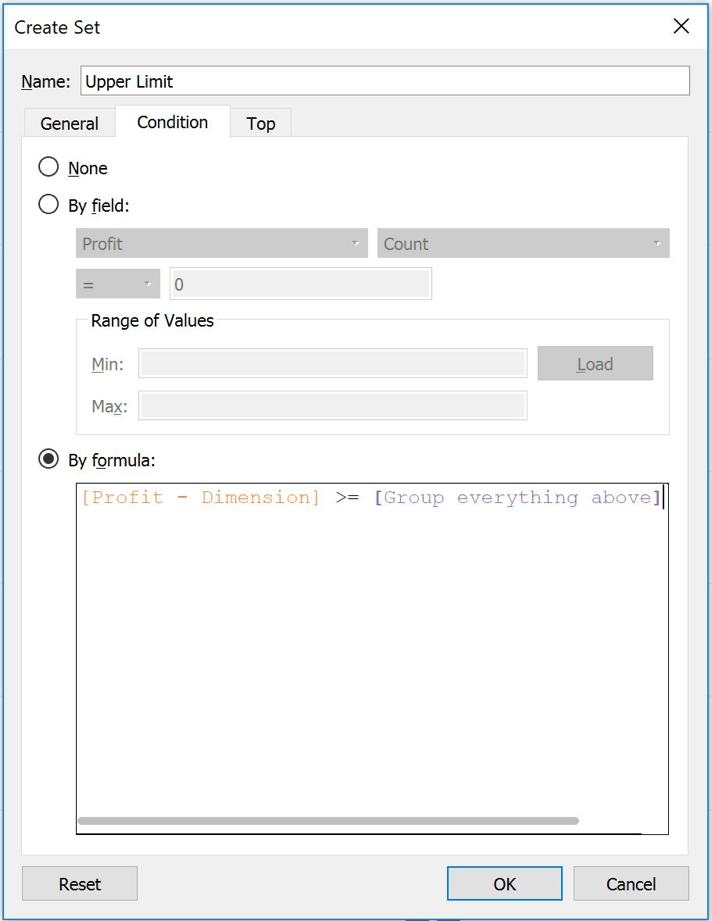
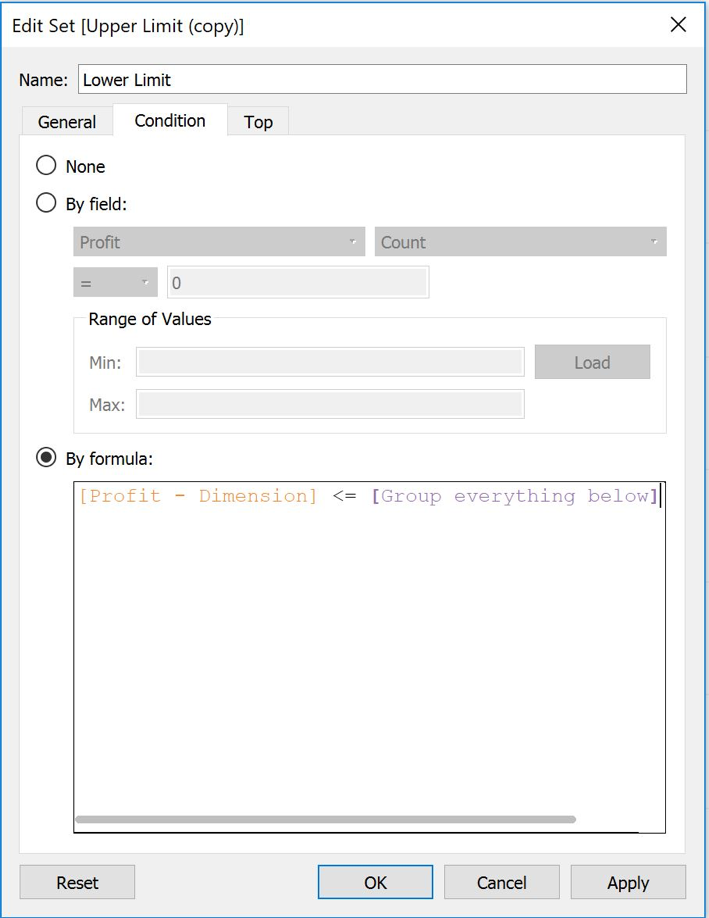
This condition dynamically flags anything greater than the limits the end user will input. We can use this in a calculated field to tell Tableau what we want to group. Lower Limit will look very similar, just be sure to use <= to tie Lower Limit to the Group everything below parameter:
We’re on the home stretch people! At this point, all that’s left is to create the final calculation that will drive the view. The trick behind the calculation is to use the Boolean nature of sets to formulaically choose to display one of our parameter values or the bins themselves. Here is a snapshot of the calculation:
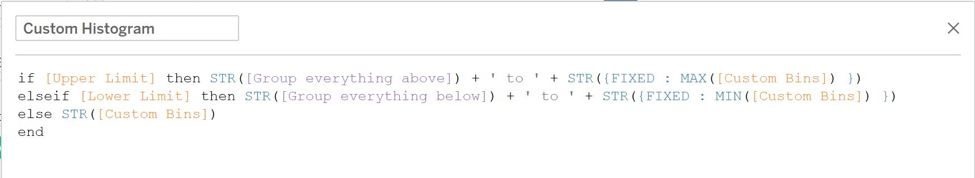
The first and second IF conditions check to see if a value is in either set. If it is, then it then creates a label by combining the user input from either parameter with two strings. The first string is just text to make the label easier to read. The second returns the maximum or minimum of the custom bin calculation. It does this by using the fixed LOD expression with no dimensions, so it defaults to the entire data set. This allows the final bucket to show not just the values that go into the bucket but the range of the bucket as well.
Histograms are typically used to show distributions. This is a way of preserving the information about the data’s range of distribution without sacrificing the binning capability we just built. The last ELSE condition in the calculation returns custom bins as a string to match the other outputs. Unlike the sets which are returning the same value for all values over their respective thresholds, returning just custom bins allows Tableau to draw all the multiple bins inside those two thresholds.
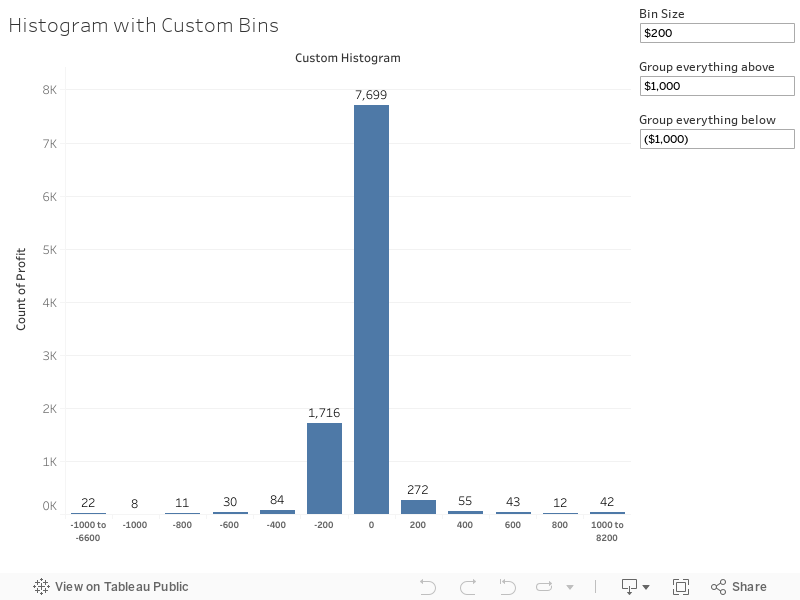
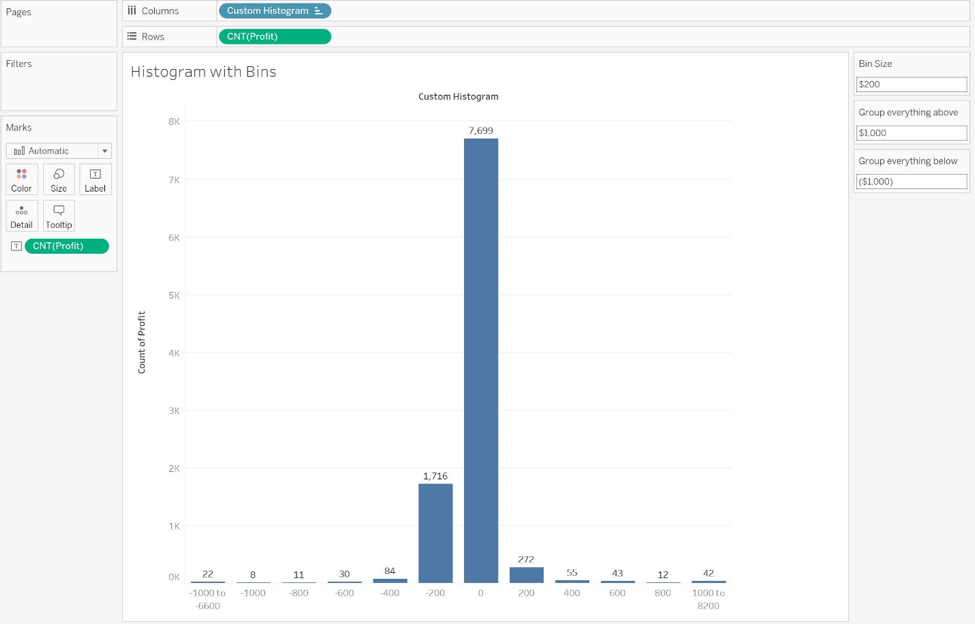
Conceptually, this technique is exactly the same as Tableau’s Showing Top N and Others but applied to histograms. Once you have that calculation built, drag it onto the Columns shelf, add CNT([Profit]) to your Rows shelf and Label menu, show the parameter controls for Bin Size, Group everything above and Group everything below, and you’re good to go! Here is what the final view looks like:
Unfortunately, this method does have some limitations. You can’t convert the bins to be continuous and keep the bin labels. You also can’t show missing values to see all bins in the view. Text formatting is also an issue in Tableau, so matching number formats is a challenge. But, given its flexibility and ability to condense views, I’ve found it a handy view to have in my toolkit. Check out the final viz below and enjoy!