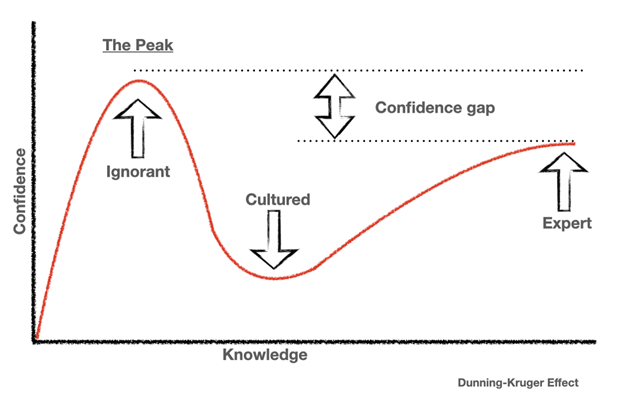
I’ve always loved Spotify’s year-in-review analysis. But, as a data nerd, I yearn for the underlying data – the stories I know are there but don’t have access to. While I know Spotify makes a lot of this data accessible through it’s API, I have very, and I mean very, limited coding ability. I have some experience in R, plenty in SQL, but that’s about it. Unfortunately, most documentation or articles I found required Python skills. So, in previous years, I would start, make progress and then feel the steep slide of the Dunning-Kruger effect and give up.
Not this year. This year, rather than throwing in the towel, I decided to go for it.
But, how would I address the *ahem* gaps in my python knowledge? I want clean, Tableau-ready data. How did I plan to pull the data, clean it and export it? Here enters Dataiku.
What Is Dataiku, and Why Does It Work Here?
Dataiku is a unified virtual environment that includes coding capabilities (but doesn’t require it!) as well as data cleansing and preparation tools. It also has incredible machine learning and AI capabilities that I, sadly, will not be using on this project (yet).
Dataiku was the perfect tool for this project. Its code friendly environment would be a great way to access Spotify’s API. With its ability to asynchronously collaborate with my coworkers, I could lean on my more Python-savvy coworkers. I could also utilize many of Dataiku’s built-in data prep tools to compliment my code rather than spending more time than I needed to perfecting and learning code.
The Dataiku Flow
I’m not going too into the weeds with my Dataiku flow, but I do want to give some highlights. I was pulling from three endpoints on Spotify’s API: artist, track and audio features. I was relieved to learn Dataiku’s coding tool allows for multiple outputs, so I didn’t have to worry about trying to combine the data using code.
Using the clean recipe, I was able to easily remove whitespace, unused fields, and get my data ready for combining and visualizing. I was especially impressed by the Smart Pattern feature for Regex. Regex is an incredibly powerful tool but extremely complicated. Typically, when I have a problem I know Regex could help with, I spend the first hour or two googling how Regex works. With Dataiku’s Smart Pattern tool, all I had to do was highlight a substring or two, and out pops the Regex expression I was looking for!
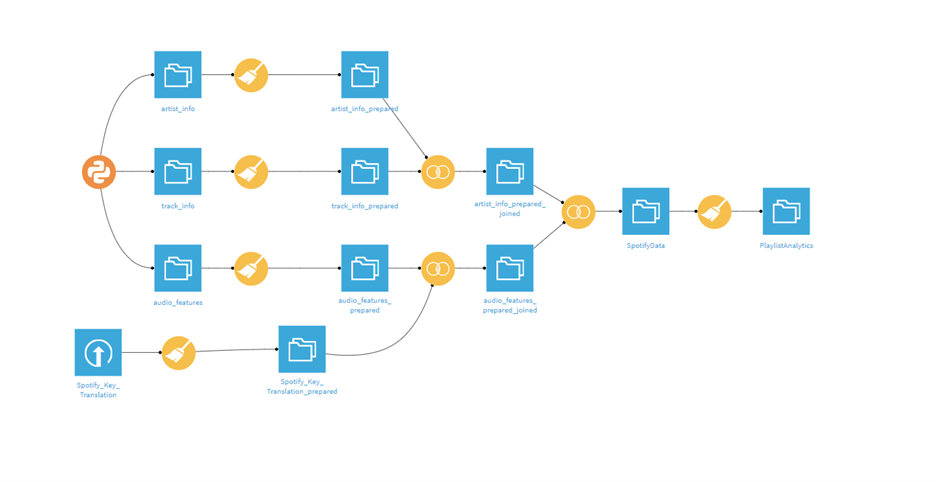
After a few simple join steps, I was able to bring together all the data into one, Tableau-ready table. I do want to note I could have joined all the tables in one recipe, but I am a cautious man that likes his double and triple checks.
The Output from Dataiku
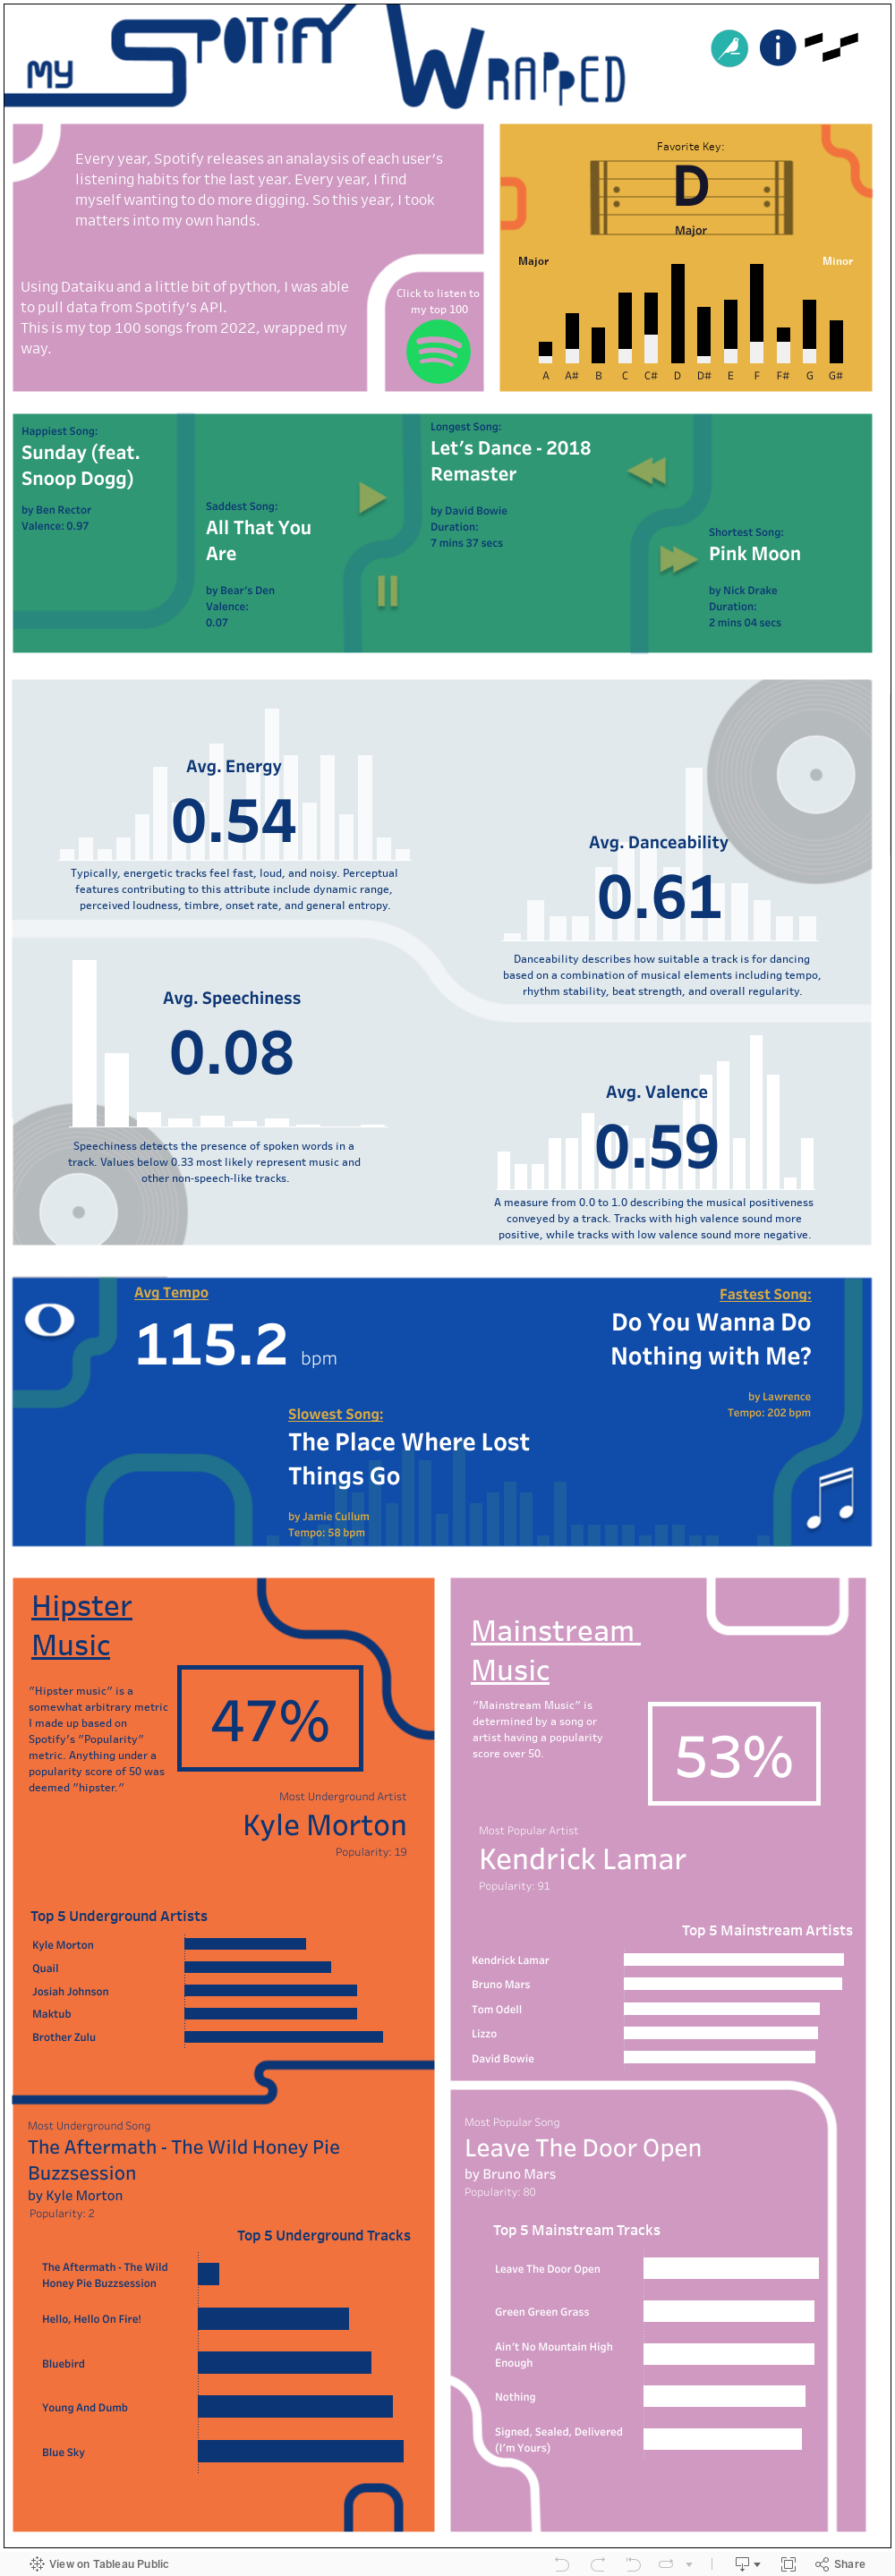
After learning a bit of Python and utilizing the power of Dataiku, I ended up with a table full of metrics like danceability, energy, popularity and more. They even had a metric called “valence” which aims to measure the “happiness” of a song. How do they calculated this metric? I wish I knew. Although the methodology is vague, the results seem pretty accurate. At least in my small sample. The lowest valence song in my top 100 was a devastating breakup song called “All that you are.” A tender song, “All That You Are” by Bear’s Den opens with the lines “Goodnight, don’t cry, you never loved me like you think you did.” Heavy stuff.
The happiest song, or highest valence song, was “Sunday” by Ben Rector, featuring Snoop Dogg. Snoop really captures a certain essence of joy when he says, “You got me feeling like Chick-Fil-A was open on a Sunday.” If only.
The Results Visualized in Tableau
If you’d like to see more of the findings I found of my top 100 songs of 2022, you can view “My Spotify Wrapped” Tableau Dashboard below: