
If you liked the legendary Drawing Tool, you’re going to love this new tool! Meet Custom Background Image Studio, also known as CBI Studio.
CBI Studio builds out and completes the creative experience for users. With CBI Studio, you can get everything you need regarding custom shapes without jumping in and out of different tools. With new features and a slick, streamlined process, CBI Studio opens up a more comprehensive, convenient arena in which users can extend and sharpen Tableau. But how did we get here?
A Little History
Many moons ago, the InterWorks-created Drawing Tool was a big part of the Power Tools for Tableau suite, which was created in the early-mid 2010s. Power Tools allowed users to do more with Tableau than what was available out of the box. Our team of talented developers understood Tableau at a programmatic level and used their expertise to create these helpful tools. Eventually, Tableau integrated Power Tools into much of Tableau itself. As we said goodbye to the Power Tools suite, including the Drawing Tool, we continued to see opportunities to augment the power of Tableau and serve users with new innovations. Thus was born CBI Studio! Inspired by some of these earlier tools, CBI Studio is a brand new experience to support mapping and background image work in Tableau. This new tool affords even more possibilities for tailoring the Tableau experience.
Behold: A New and Improved Tool
In this reimagined expansion, we’ve created a new UI and introduced new features to deliver an enhanced user experience. One of my favorites is the Edit Shape Labels feature. With this, users can add different points to create the shape you need. For example, when you’re finished adding in the points you want to work with, the data populates with sometimes less-than-helpful default labels. But now, you can edit those to something more relevant. These sorts of small but targeted tweaks are part of what adds up to the broader impact of CBI Studio.
What Is CBI Studio and What Needs Does It Serve?
There are two ways you can proceed with CBI Studio: images or maps.
The map path is simple. Let’s say, for instance, you want to map coordinates of five stores around the Tulsa metro area, which are not easy to track down. Instead of having to hunt around for the GPS coordinates, type them in manually and convert them, CBI Studio enables you to drop in an address and use your store data location in Tableau. That’s the map route.
If you want to go the image route, there are three options: paths, points and polygons.
- Points – This is where you want to use custom images. A great example is this Jurassic Park blog. The author denotes different places in the park using custom images of specific dinosaurs.
- Path – A great example of effective use of this is in Paul Middlewick’s X Marks the Spot viz. Paths are a good way of visualizing something like the metro underground.
- Polygon – I like using polygons to create separate areas in a dashboard. This COVID seating layout is an awesome example of that. My Indianapolis Motor Speedway viz is also a good example of highlighting areas.
All right, so you know what CBI Studio is, how it came to be and the value it brings to your data. Let’s get into how to actually use it, shall we?
Plot Your Own Path
Tableau’s ability to import and use custom background images is one of its most interesting and compelling features. It’s what can take a viz from boring bar charts to an immersive exploration of something unique. With CBI Studio, and hopefully the steps laid out in this article, all this could be yours.
Note: This is article will be focused on the image feature of CBI Studio. Be on the lookout for a post focused on CBI Studio’s map feature.
The path to custom background enlightenment is as follows:
- Select your picture.
- Use CBI Studio get your picture-specific data.
- Create your custom background visualization in Tableau.
Selecting Your Photo
This should be the easiest step of all. Find the image you need from your phone, online or wait until technology has allowed us to digitize our dreams into images. You can save the image to import into CBI Studio, or you can copy the image URL. For this example, I will be using an image of the storied Indianapolis Motor Speedway and the various international monuments that can fit inside of the largest sports venue in the world:
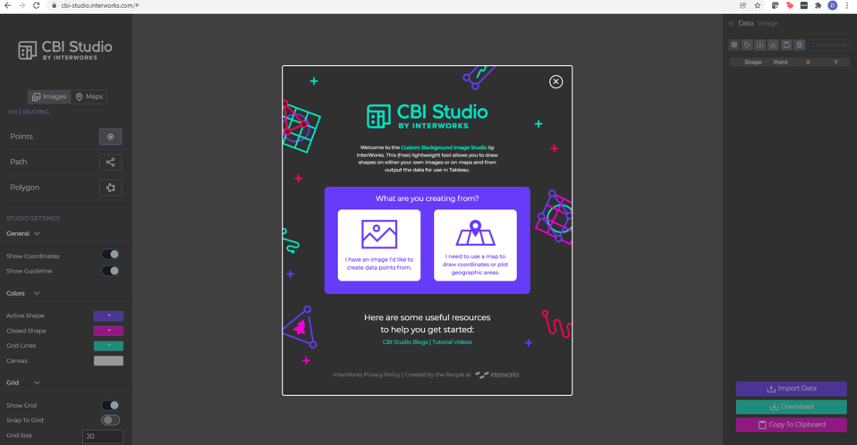
Once you’ve selected the image option rather than the map from the default pop-up, you want to add your image. If the image is in a webpage, or if you have the file on your machine, you can drag and drop it into the center of CBI Studio and it will populate. You can also select Image in the top-right corner, next to Data. Here, you have the option to choose a file from your computer’s browser. You can also paste an image URL or start from a blank canvas.
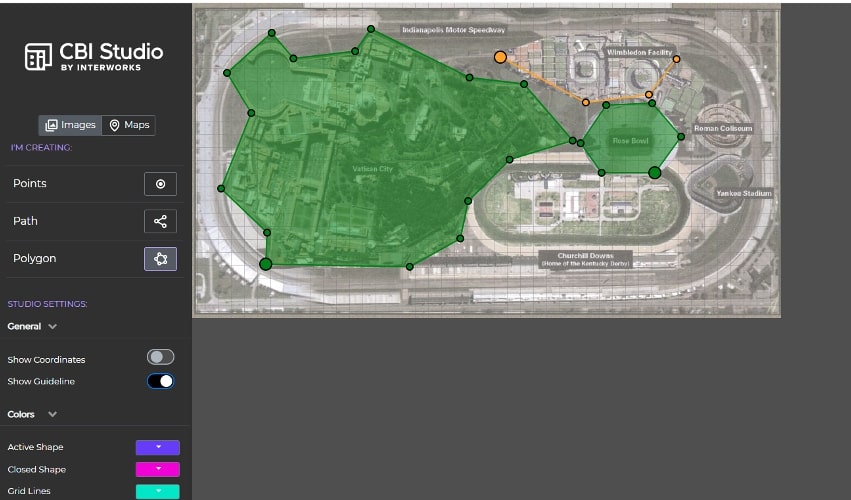
Now that we have our image in CBI Studio, we can begin translating it into information Tableau can understand. We have three different types of data we can create for Tableau: points, paths or polygons. For this example, I will be using polygons to outline the various monuments within the IMS:
Note: When using the Points option, this does not necessarily mean you need to have a circle represent that data point. You can use custom shapes to add some extra pizzaz to the view.
The Studio Settings section provides multiple options to make creating your piece a bit easier. Show Coordinates can help you make sure your points are aligned. Show Guidelines is helpful when making polygons. It allows you to see the connection between the points you are drawing. The Colors section allows you to see which shape your currently working on (Active Shape) and which shapes you’ve completed (Closed Shape). You can adjust the color of both, as well as the gridlines and canvas, which is helpful when working on images of different colors.
Finally, there is the Grid section, which allows you to show a grid and adjust its size by pixels. There’s also the snap to grid feature that you can use to help guarantee your drawing is aligned.
Now that you’ve made all the adjustments to give yourself the best drawing experience, it’s time to draw—as simple as point and click! If you are drawing polygons, you can also double-click to close the shape.
As you’re drawing, or once you’ve completed your drawing, if you are making polygons, I would strongly recommend using one of my favorite features: the Edit Shape Labels option under the Data tab on the right. This lets you label the various shapes, so you can keep track of which shape is which. Plus, it makes it easier if you have any intentions to join the data to other data.
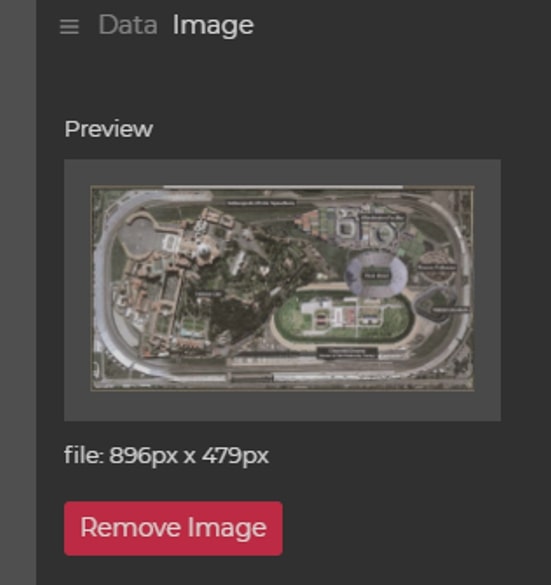
Once you’ve got all your data, you can copy to clipboard or download the data, and you’re ready to start creating your masterpiece in Tableau! Before you exit out of CBI Studio, be sure to note the file size listed under the image preview in the Image tab. These dimensions will be used as the scale for the image in Tableau:
Using Your Image and Data in Tableau
You can copy the data from CBI Studio and paste it directly to Tableau, though this is not recommended as it is a bit messy. I prefer to copy and paste into Excel and use it as a data source. This will make it easier to make enhancements and to join to other data in Tableau.
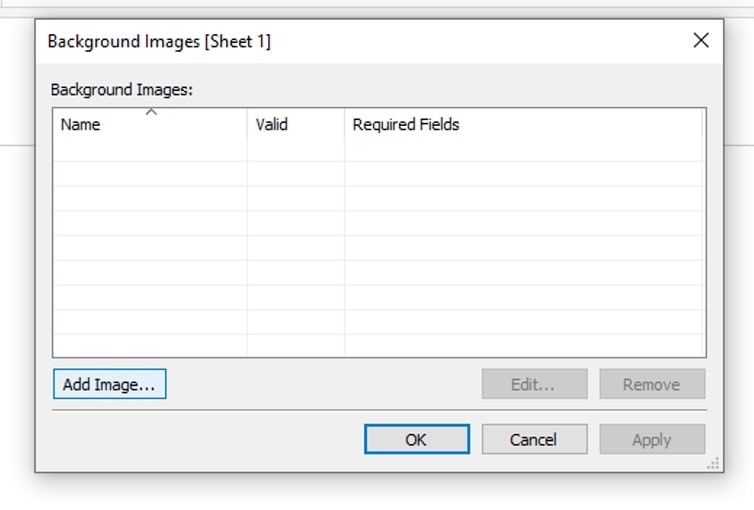
Once you have your data in Tableau, you’ll go to Maps and select Background Images and select the sheet you want to start building your viz on:
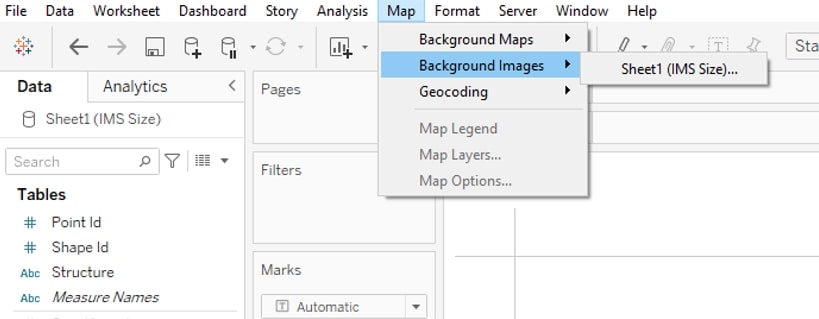
From the pop-out menu, select Add Image:
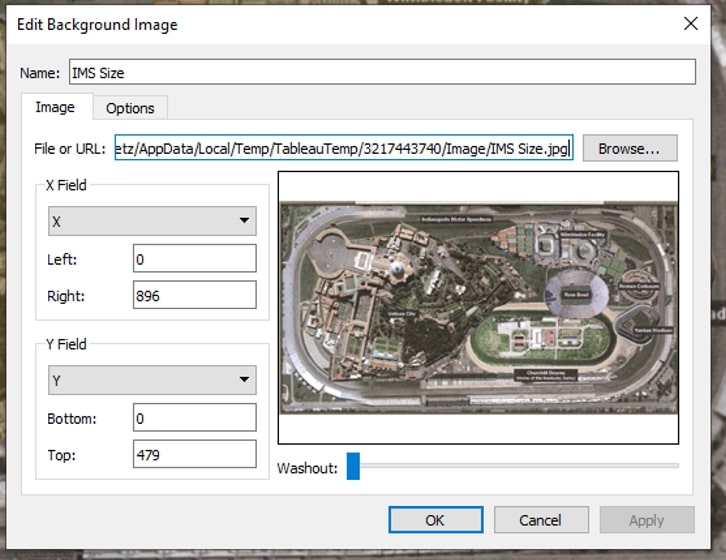
From the following pop-out menu:
- Select the file or URL of the image.
- Map the fields X and Y using the drop-down for each (luckily, CBI Studio names the X field X and the Y field Y, so it’s easy to keep straight!).
- Using the file size from CBI Studio, use the width (the first number of the file size) as your dimension for Right and the height (the second number) as your dimension for Top. You can keep Left and Bottom as zero.
Once you click OK and the dialog box exits, you may notice the remaining pop out says invalid. This is just because the image has not been mapped in any sheets. It’s okay to ignore this for now.
Next, on a blank sheet:
- Place X on Columns.
- Place Y on Rows.
- If you are using Points, put Shape on Detail.
- If you are using Lines or Polygons, make sure the Mark Type is set to Polygon then put Shape on Detail and Point on Path.
- Finally, right-click on both axes and deselect Show Header.
There you have it! You’re on your way to creating your one-of-a-kind Tableau masterpiece! Feel free to explore CBI Studio right away or check out some more helpful resources below. Here’s a link to a downloadable example of my Indianapolis Motor Speedway visualization you can dissect for inspiration, as well as some video demos of using CBI Studio on both images and maps.
For a video demo of the complete process working with images in CBI Studio, check out the video below:
For a video walkthrough of CBI Studio’s functionality on maps, watch below: