
I’ve been going to Tableau Conferences ever since the first one at the Edgewater Hotel in Seattle in 2008. There were around 200 total attendees, including all of the Tableau employees, at that time. I wrote extensively about my time at each successive conference in this blog post highlighting last year’s event. TC 2020ish will be my 12th in the U.S. and 16th total, including two in London, one in Amsterdam and one in Barcelona. This year’s conference is unusual in the obvious way: it’s virtual. There are also 120,000 people registered. WOW!
Tableau’s decision to go virtual was driven by COVID-19, but the ability to reach a much larger number of people (around 120,000 registered) is an opportunity. Based on day 1, I think Tableau is doing a good job delivering value in bite-sized nuggets. I’m going to focus on CEO Adam Selipsky’s keynote in this post.
Three Stories and Themes
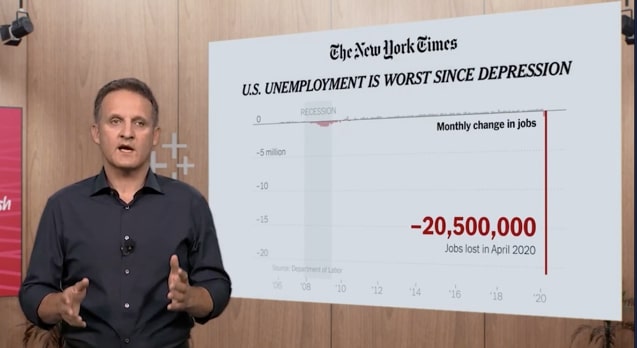
Unsurprisingly, Adam stressed the importance of timely data from multiple sources in order to enable better decisions. He spoke about his own instincts and how wrong he would have been in making decisions without access to Tableau and the data his team and the Tableau Community have developed over the past seven months. Adam pointed out Tableau’s commitment to helping everyone have better access to COVID-19 data through Tableau’s COVID-19 Data Hub.
If you haven’t investigated the data hub, you should. Tableau has aggregated many different public data sources, and the community has created 29,754 dashboards (as of 6 October 2020). You can download these workbooks, investigate different health and financial aspects of the virus and learn new techniques.
Kelly Jin, Chief Analytics Officer, City of New York
The focus of this discussion was on how Kelly’s team is using Tableau to help the leadership of New York City ingest, enhance and present timely information from multiple data sources to different local government leaders, all the way up to the mayor’s office.
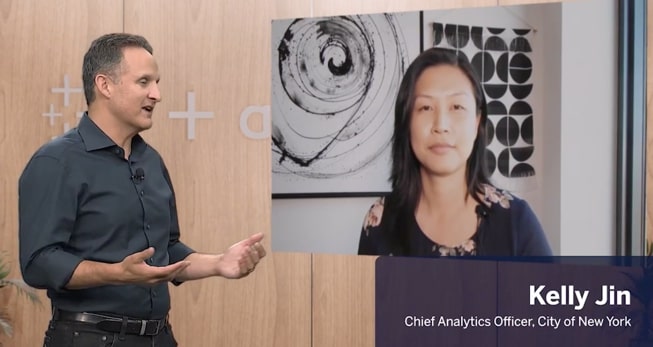
She further discussed how NYC is using data to understand COVID-19’s impact on different industry and healthcare facilities. One specific example cited using Tableau as a “force accelerator” to provide guidance to ambulances on where intensive-care-unit beds are available in the city.
Dr. Michael McAfee, President & CEO, National Equity Atlas
Most years, a pandemic would be enough bad news, but 2020 is special, with the added stress of racial tension due to police violence on minorities.
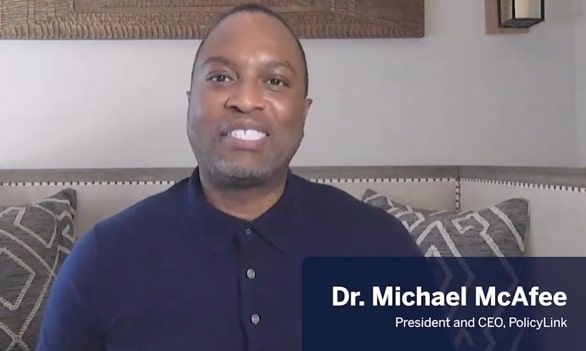
The National Equity Atlas is providing the nation’s most detailed report card on racial and economic equity. Adam and Dr. McAfee discussed the importance of data and information in promoting racial and economic equity. Adam also stated that Tableau was committing over $10M through the Tableau Foundation to make data a cornerstone of the racial-justice efforts happening throughout the country.
Joe Atkinson, PWC
PWC is one of the largest consulting companies in the world and Mr. Atkinson explained how data was helping PWC effectively navigate the pandemic. Nobody could have predicted the timing and nature of COVID-19’s impact on commerce. Joe explained that several years ago PWC made big investments in Tableau and enablement ($3B). He felt that by not only investing but also “skilling-up,” they have been able to effectively navigate the challenges presented by COVID-19. In short, Joe feels those investments are paying dividends. He feels confident in PWC’s ability to make informed decisions using timely information. He also feels that PWC clients have noticed.
InterWorks Can Help
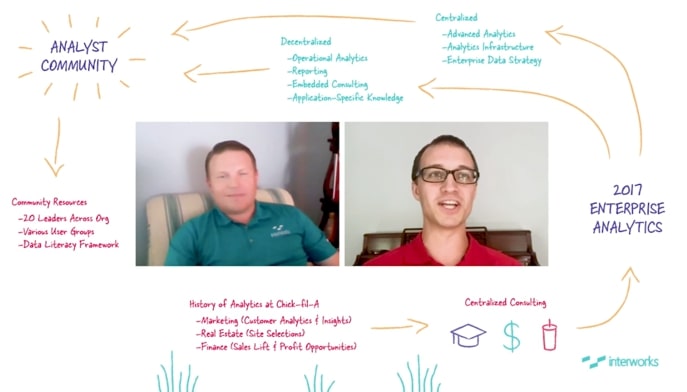
If you missed the session on Tuesday that InterWorks’ Karl Riddett did with Justin Winters of Chick-fil-A, keep an eye out for a post on that talk hitting the blog soon. Karl and Justin discussed how a proactive deployment and enablement of their team has paid dividends for Chick-fil-A this year. In the session, our marketing team did a good job of providing some screenshot-able images that contain checklists you can use for your own business.
I hope you’ve made the most of your TC experience this year, in spite of its shift to virtual. Be sure to check back on the blog for more TC insights and Tableau tips, and remember to reach out to our team at InterWorks for support, guidance and collaboration!