This series examines some advanced techniques of Tableau Tooltips and will help you effectively build upon an already solid foundation.
Bringing an image into a tooltip can be a great way to show additional information in a visually interesting way without overcrowding a dashboard. It could be used to bring in a picture of a product, branded logos or icons to help your viewer link together different pieces of info in a dashboard.
Contextualizing Tableau with Images
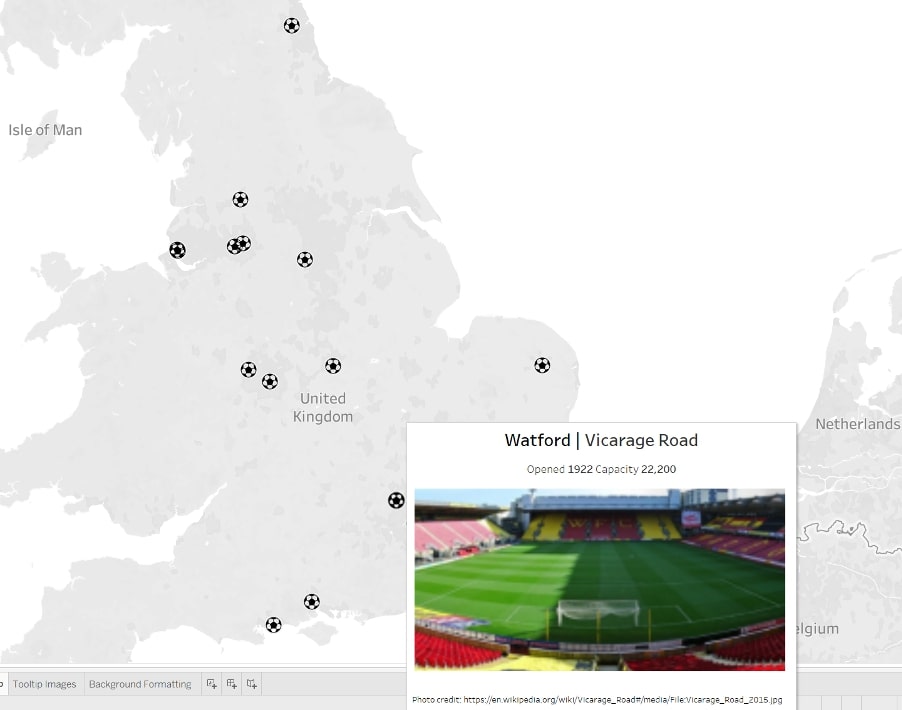
There is no way to bring images directly into a tooltip, but by using custom shapes and a viz in tooltip, we can work around this. In my example, I’ve taken Premier League football stadium information from Wikipedia and created a map that shows an image of each stadium as you hover over it:

The first thing to do is to locate the image, or images, you want to use. If you want something fixed (like a branded logo that appears in every tooltip), you may only need one image. In my case, I need 20 images—one for each stadium.
Save the image(s) in a folder within this directory: My Documents > My Tableau Repository > Shapes to make them available for use in Tableau.
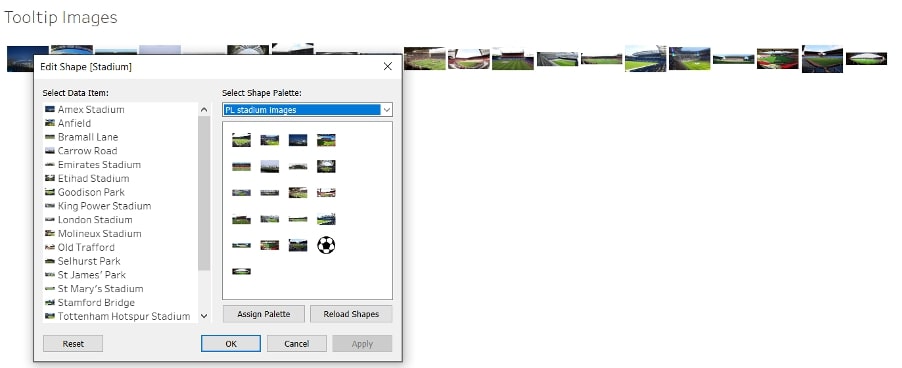
Open up a new Tableau sheet and drag on the dimension you want to use to distinguish between your images. If you only want to use one image, create an ad hoc calculation in the Rows shelf of ‘’ then hide headers. Change the mark type to Shape, and click Shape to open the Edit Shape window. Find the shapes you added to your Tableau repository and match them to your dimension members:

Change the view to Entire view. In your main view, go to Tooltip and insert the sheet of shapes you’ve just created. Adjust the size of the viz in tooltip if needed. Right-click on the Tooltip sheet and hide it. There you have it!

