TL;DR: Quick LOD calcs make LODs easier, which is slightly concerning. However, this could lead to some major time saving and teaching opportunities if the feature is built upon.
Great New Feature, Great Responsibility
When Tableau added Quick LODs in its most recent release, I’ll admit I was … confused. I didn’t see the value to the feature right away. In fact, I was initially a little worried. Level of detail calculations are one of the trickier things to wrap your head around in the world of Tableau. Making these calculations simpler, and more accessible, made me worried that LODs would become widely misused and widely misunderstood. When teaching LOD in intermediate Desktop courses, I typically spend about two hours walking talking through the concept, using multiple examples. So, the idea that this could be simplified to just a simple “drag-and-drop” worried me. And it still does. But the more I thought on this new capability, the more I realized what it could grow into.
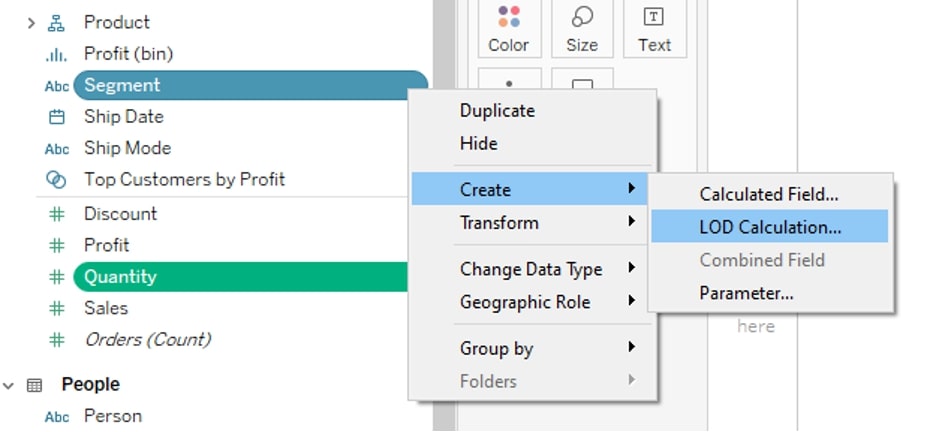
As of 2021.1, Quick LODs allow you to select one dimension and one measure, right-click, and choose Create LOD Calculation. You can also drag and drop one onto the other while holding control. But I’m going to focus on the right-click method because that’s where I think the future of Quick LODs lay. Currently, this feature is limited to one dimension and one measure. However, if you could select a single measure and multiple dimensions, this feature could become a game changer:

Let me explain why using a generic example.
You have a crosstab broken down by multiple dimensions and one measure on Text. This crosstab is giving you the exact numbers you need. They’re spot on. However, you need to use these numbers in a different view because it’s Tableau. Ideally, you’re building beautiful vizzes, not crosstabs. But every time you add this measure to the new view, the numbers are changing. They’re not right anymore.
Enter Quick LODs.
The Future of Quick LODs
All right, so here’s a hypothetical. If you could select multiple dimensions for your quick LOD, all you’d need to do is look at all the dimensions and the measure in your crosstab view, select these fields from your Data pane, and choose Create LOD Calculation. Boom. You’ve got the numbers you need, unaffected by how you adjust the view.
Now, I’d be remiss if I didn’t say this also raises multiple red flags in my teacher brain. But this feature doesn’t exist yet, so I won’t talk about these red flags until it does. But rest assured; there are concerns with that, and if this feature comes to fruition, I will already have a blog post teed up and ready.
This could make troubleshooting, teaching and understanding LOD calculations much easier, taking up only a portion of the time it currently does. So, while quick LODs may seem underwhelming at first, there is the potential for something really exciting here. Best of luck as you explore the feature, and don’t hesitate to reach out if we can help you along your analytics path!

