Here’s the scenario: I work at Global Superstore. We sell products from lots of different sub-categories. I can always reference this from our Master Inventory File:

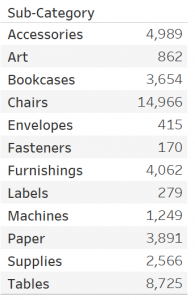
I get weekly sales data sent to me, and my job is to make a weekly report for each region that gives them their sales. This month, I load in my data and it looks as follows. OK, so we didn’t make any sales in Appliances, Binders, Copiers, Phones or Storage:
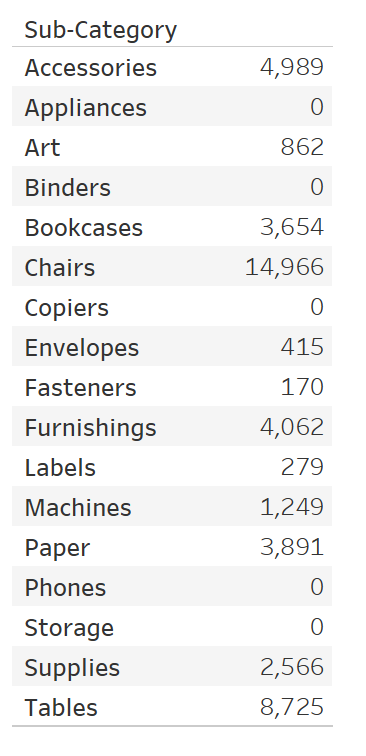
My supervisor asks that we still show those so that each region knows there weren’t any sales.“No problem,” I think to myself. I pull in my master sub-category inventory list and left join my weekly sales data to that on the field of Sub-Category. Overall, looks good. I throw a ZN() in front of my Sum(Sales) to show zeroes where we didn’t have sales last week:
And I go to add in my Region filter to show these weekly sales for each region:
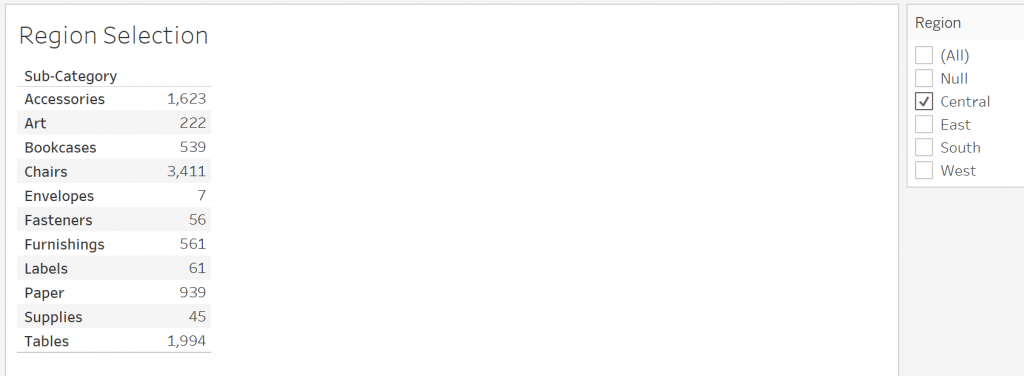
If I select the region of interest, my sub-categories disappear again. Notice there’s also a Null region, as well. For those of you who are SQL pros, you may be a step ahead of me, but let’s walk through what’s happening. We have two tables, that look somewhat like the following:
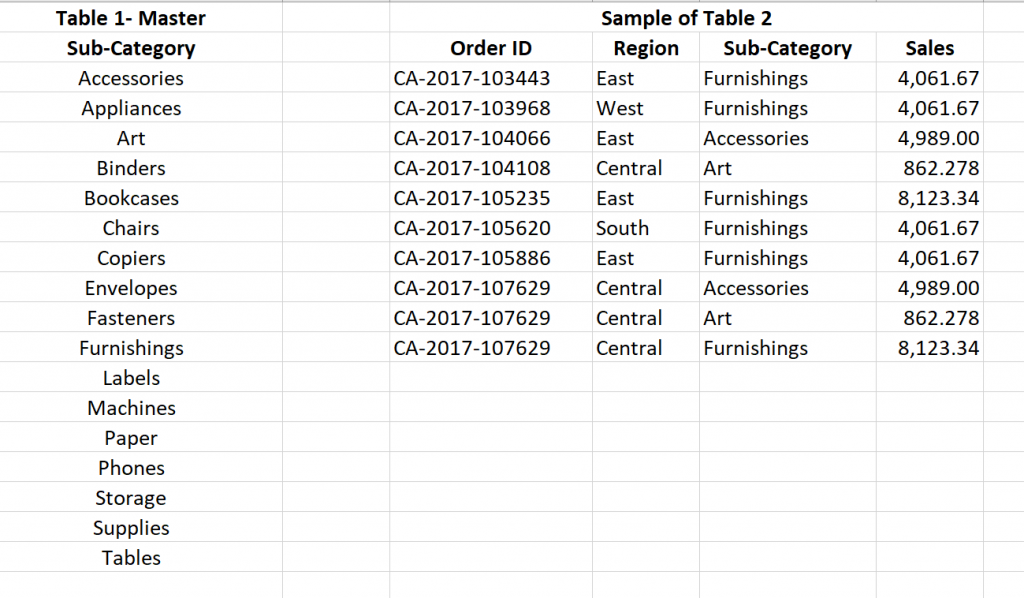
When we left join on Sub-Category, our resulting table now looks as follows:
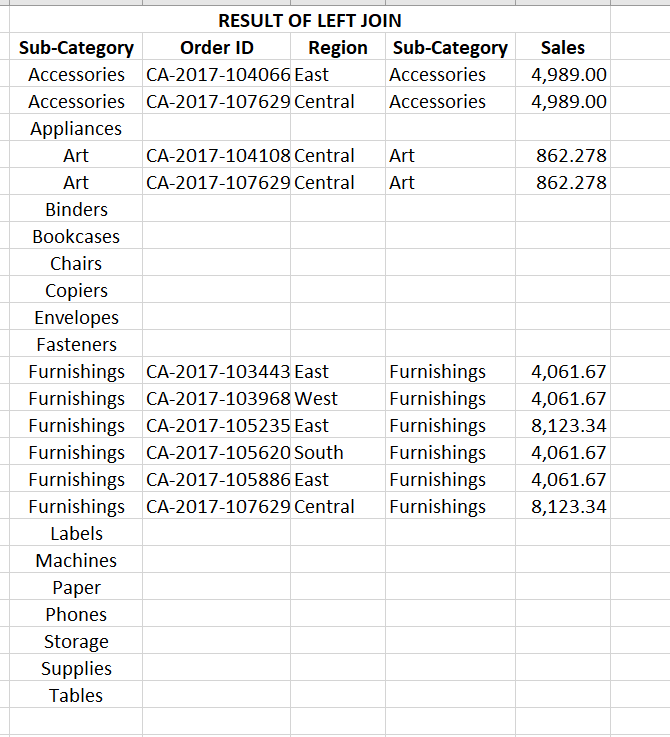
So, as you can see, anytime we filter on Region, we’re excluding any sub-categories that didn’t have sales that week. We could go back and select Null region as well, but that’s not intuitive for users at all. One potential solution is to create a second data source that gives us every combination of Sub-Category and Region as well as the ability to use that new datasource as our left join instead of our master list.
Cue Tableau Prep.
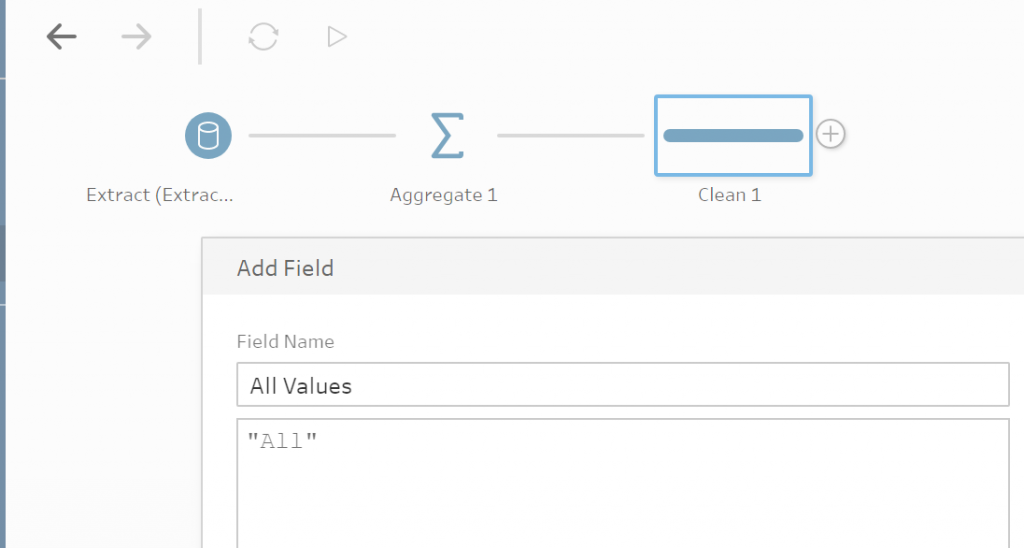
I want a record of every possible combination of Region and Sub-Category, so I first bring in my Master Sub-Category file. From my Master Sub-Category datasource, I group by Sub-Category. Next, I’ll also need a field to join on. Since I want every combination, I just create a calculated field called AllValues, which is just the string value All:
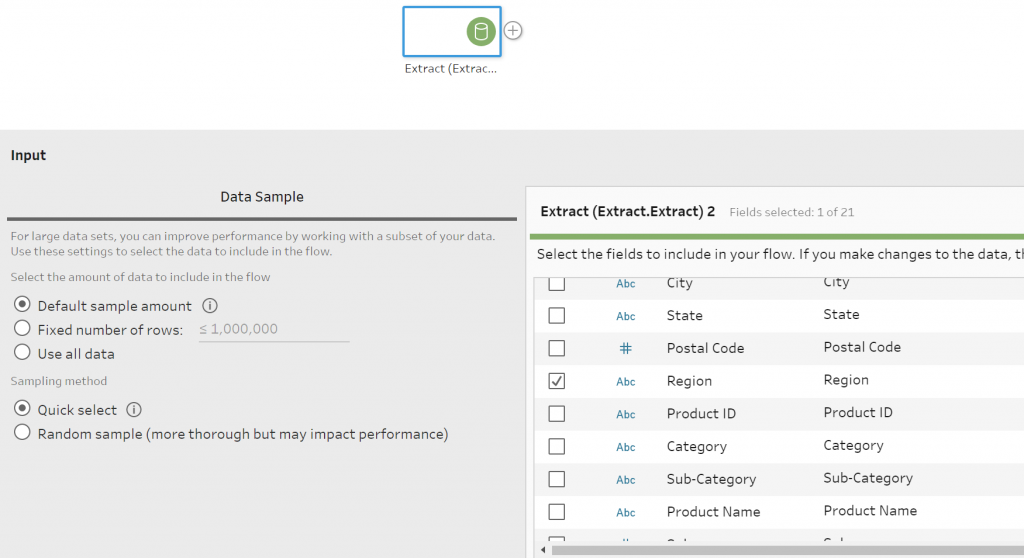
Next, I bring in my Weekly Sales datasource and select to only see my Region field:
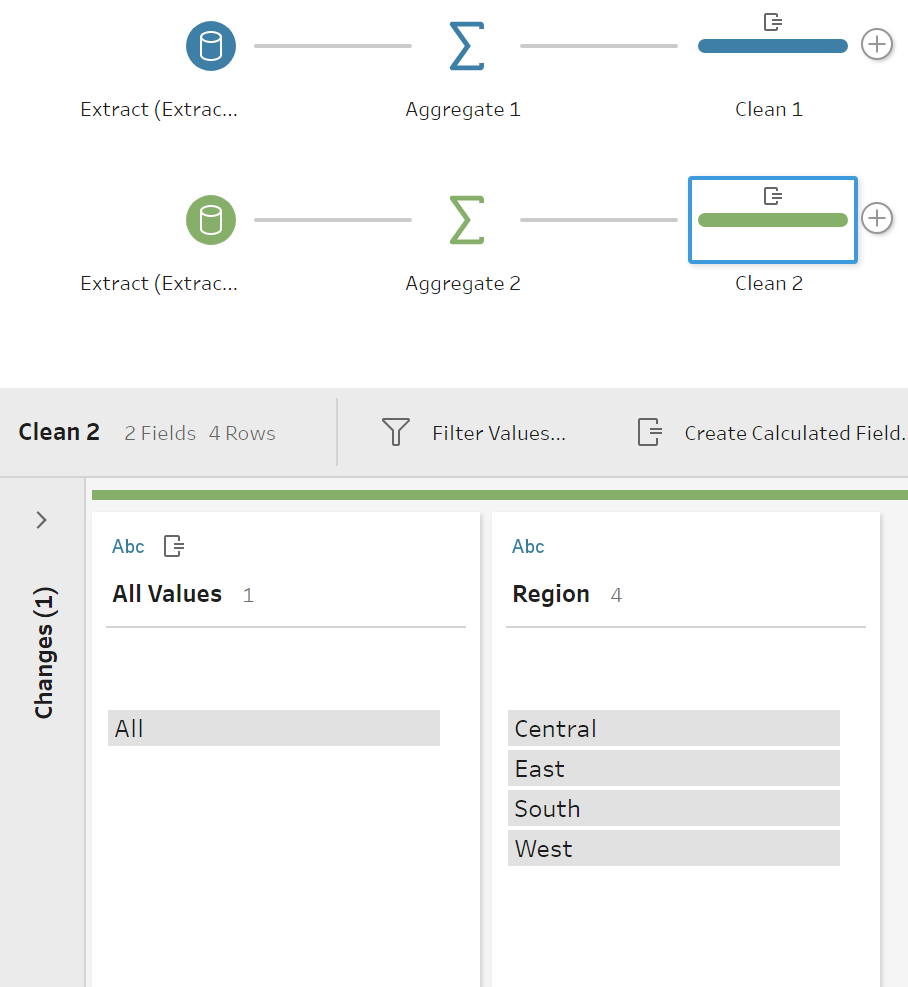
I group by Region and then create that same All Values field I did in my Master Sub-Category datasource:
Now, I can join these two datasources on my field All Values field. Once I have my new table, I group by my fields Sub-Category and Region and then output this new Master Table back to an extract so I can use it in Tableau:
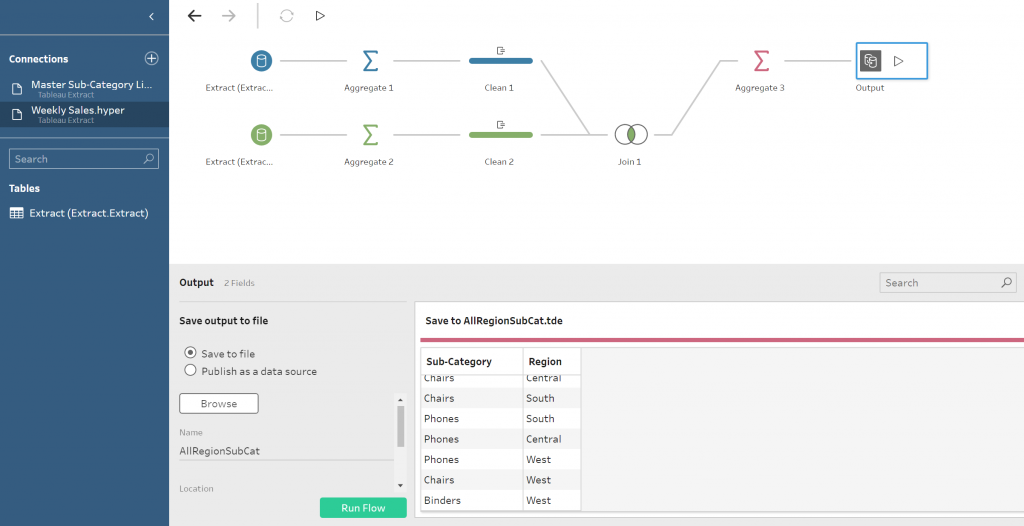
I run the flow, and I’m good to go!

Alright, so now I can go back into that data connection window and set up the left join again so that the new file I just created in Tableau Prep (AllRegionSubCat) is being joined to my original weekly sales file – this time on both Region and Sub-Category:
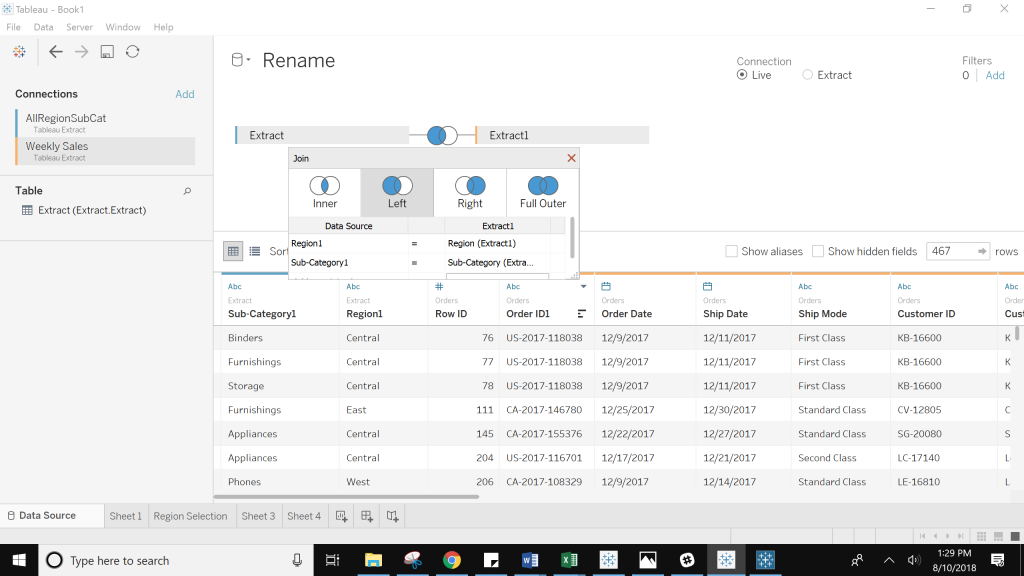
Now, back in my view, I want to make sure I still have Sub-Category from my Master Table on Rows. Now, instead of filtering on the Region field from my Weekly Sales table, I have a Region field from my Master Table (AllRegionSubCat) that I can use instead. I bring the Region field from my AllRegionSubCat master file to Filters, and my view now looks like I want it to:
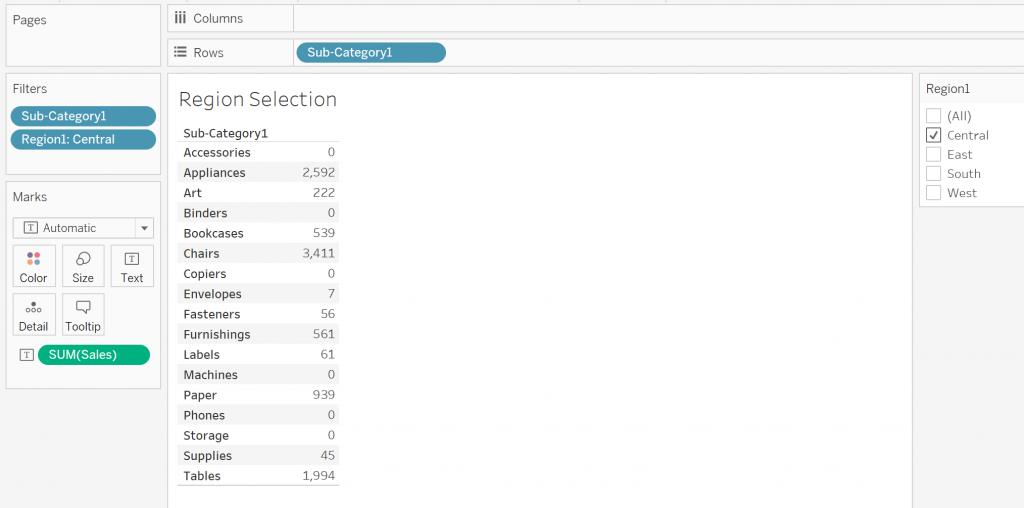
No null Region Filter option. No disappearing sub-categories. If you aren’t able to do a join with your data, you could also set this up with a blend. As long as you have this Master Table as the primary datasource, it would work the same way.
The key here is that you want a table that gives you every unique combination of any fields in your view, including those that you’re filtering by. One of the easiest ways to create that table is using Tableau Prep!

