Questions from Tableau Training: Isolating Rank with Parameters and Calculations

Data

Questions from Tableau Training: Isolating Rank with Parameters and Calculations

Our Certified Tableau Trainers are asked a myriad of questions each day. In this series, they share some answers.

“I have sales information about all 50 states, but I only want to see a single state and how it ranks. Sounds like a table calculation, but there’s a catch. Table calculations in Tableau only compute the calculation on data that is in your view. If I filter so I’m only looking at the state I care about, it will have a rank of 1. As exciting as that may look, it is a lie. So how can I make it so that I only see my state and not the 49 I don’t care as much about?”

The answer is a combination of parameters and calculations.

Step 1: Creating a Parameter

Create a parameter that is based on what dimension you are trying to look at. We want to allow the user to select from a list of states, so we need the parameter to include all of them. We could type all of these out, or we can use the parameter creation to get this list from the data itself.

creating a parameter to isolate rank

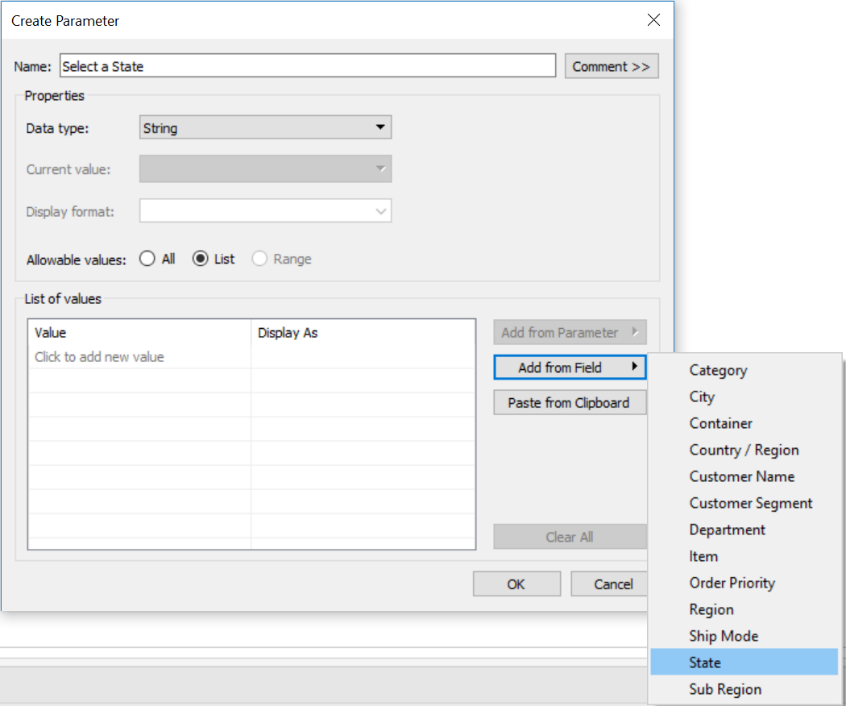
Right-click on the newly created parameter and show the parameter control. Select the State you care about. I’m from North Carolina, so that’s the one I’ll be choosing.

Step 2: Creating a Calculated Field

Create a calculated field that will be true when the parameter is the dimension option you want. For this example, that will be when State is equal to our Select a State parameter:

creating a calculated field to isolate rank

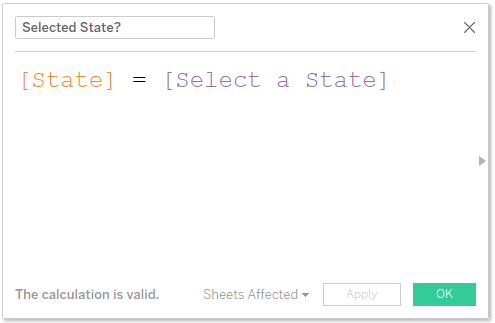
When I’m creating a Boolean calculated field, I like to put a question mark in the name of the field. It’s my helpful reminder that it’s Boolean and what true and false represent.

Step 3: Starting to Create the Visualization

Put your calculated field onto either rows/columns. Next to that, put your dimension field:

creating a visualization when isolating rank

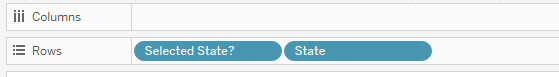
We also need to see the rank for each of our states based on the sales. Bring sales into your view, and create a table calculation on it to calculate the rank:

quick table calculation to determine rank

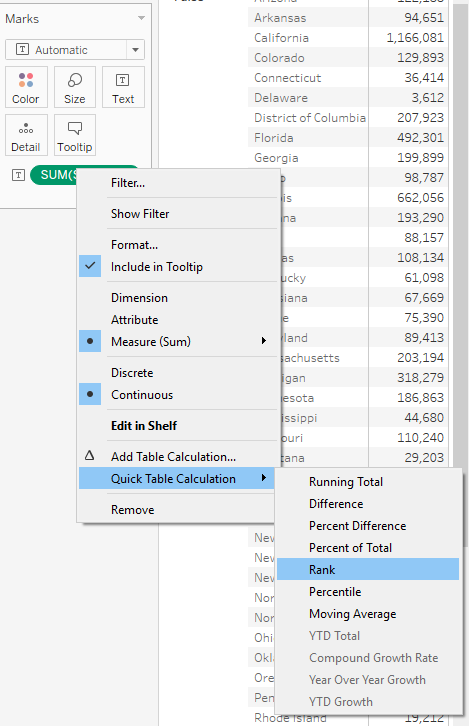
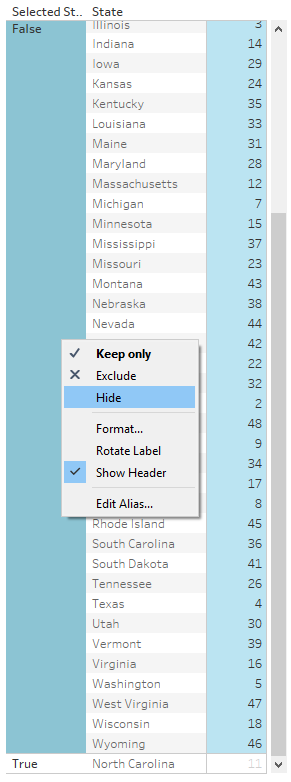
Step 4: Hiding What We Don’t Care About

Doing step 3 should have made it so that your states are divided into two groups: False and True. And lookie there! The State we’re interested in is in the True group, and everything else is in the False group. Let’s get rid of those pesky other states. Right-click on False and select Hide:

hiding extraneous data when isolating rank

Step 5: Cleaning up the List

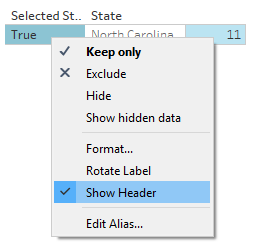
Now that we’ve gotten rid of those other states, we don’t need the True label anymore. Right-click on True and uncheck Show Header:

hiding data when isolating rank

Step 6: You Did It!

There is no step 6 except to sit back and be proud of yourself. Or change some of the formatting to add a little more pizzazz, such as making the font bigger and adding the state name under the rank, so you can add it to a dashboard. It’s up to you!

isolated rank North Carolina

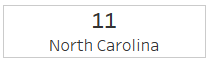
Not bad, North Carolina…not bad.

Want More Questions from Tableau Training

  1. Questions from Tableau Training: Quick Filter Interaction
  2. Questions from Tableau Training: Labeling with Table Calculations
  3. Questions from Tableau Training: Speeding Up Presentation Views when Using Tableau
  4. Questions from Tableau Training: Dashboard Actions
  5. Questions from Tableau Training: Business Day Calculations
  6. Questions from Tableau Training: Adding Gaps Between Bars
  7. Questions from Tableau Training: When to Pivot Data in Tableau
  8. Questions from Tableau Training: Adding Conditional Formatting
  9. Questions from Tableau Training: Setting Weekday Start
  10. Questions from Tableau Training: How Do ZIP Codes Work in Tableau?
  11. Questions from Tableau Training: The Small Grey Bar Within a Quick Filter
  12. Questions from Tableau Training: Matching Mark Color
  13. Questions from Tableau Training: Showing the Null Indicator
  14. Questions from Tableau Training: Can I Manually Set the Colors of a Stepped Gradient?
  15. Questions from Tableau Training: How Can I Get Box Plot Data into a Crosstab?
  16. Questions from Tableau Training: How Do I Clear a Worksheet? Make a Copy?
  17. Questions from Tableau Training: Opening URL Actions Inside of a Dashboard
  18. Questions from Tableau Training: Can I Move Mark Labels?
  19. Questions from Tableau Training: How Can I Use My Current Report to Create a Viz?
  20. Questions from Tableau Training: Can I Create Text Hyperlinks on a Dashboard?
  21. Questions from Tableau Training: How Can I Transform My Crosstab into a Flat List?
  22. Questions from Tableau Training: Labeling the Top N
  23. Questions from Tableau Training: How Can I Customize Charts with Parameters?
  24. Questions from Tableau Training: Combining Measures into a Single Line
  25. Questions from Tableau Training: How Can I Create Custom Color Palettes?
  26. Questions from Tableau Training: Can a Top N Parameter be Nested Within Other Fields?
  27. Questions from Tableau Training: Conditional Scope on Tableau Calculations
  28. Questions from Tableau Training: Top Ten Plus N
  29. Questions from Tableau Training: Dynamic Label Positioning
  30. Questions from Tableau Training: Using Cross Joins to Solve Active Tickets
  31. Questions from Tableau Training: Top N Highlight Table
  32. Questions from Tableau Training: How to Use Specific Dimensions in Table Calculations
  33. Questions from Tableau Training: Moving Reference Line Labels
  34. Questions from Training: Comparing Metrics for Same Weekday in Previous Year
  35. Questions from Tableau Training: Colouring Specific Columns and Rows in a Crosstab
  36. Questions from Tableau Training: Creating a Custom Legend as a Sheet
  37. Questions from Tableau Training: How Can I Draw a 45-Degree Angle?
  38. Questions from Tableau Training: Down the Aggregation Rabbit Hole
  39. Questions from Tableau Training: Percent Change from Previous Period on a Map
  40. Questions from Tableau Training: Union File Names as Years
  41. Questions from Tableau Training: Conditional Coloring on Sparklines
  42. Questions from Tableau Training: Moving Column Headers to the Top of the View
  43. Questions from Tableau Training: Isolating Rank with Parameters and Calculations

More About the Author

Rachel Kurtz

Analytics Architect
Meet InterWorks’ First Neuron: Rachel Kurtz Recently, Dataiku announced their 2022 class of Neurons—the highest performing and most passionate members of the Dataiku community. ...
Meet Dataiku, the Everyday AI Powerhouse for Your Data “The goal is to turn data into information and information into insight.” This quote from former Hewlett Packard CEO Carly Fiorina ...

See more from this author →

InterWorks uses cookies to allow us to better understand how the site is used. By continuing to use this site, you consent to this policy. Review Policy OK

×

Interworks GmbH
Ratinger Straße 9
40213 Düsseldorf
Germany
Geschäftsführer: Mel Stephenson

Kontaktaufnahme: markus@interworks.eu
Telefon: +49 (0)211 5408 5301

Amtsgericht Düsseldorf HRB 79752
UstldNr: DE 313 353 072

×

Love our blog? You should see our emails. Sign up for our newsletter!