
Despite the famous traffic and occasional earthquake, over four million people choose to call Los Angeles home. With warm weather, vast cultural and ethnic diversity, and Hollywood, many people want to pursue their creative dreams here. I am one of those people. Growing up on the East Coast, I dreamt of bumping into my favorite celebrities and scratching my performance itch through stand-up comedy. That said, I was also familiar with its criminal repute – first through fiction in numerous films and television shows, and then in my studies in middle and high school.
I recently moved from West Hollywood (where I lived for almost eight years, which is its own city and under the jurisdiction of the LA County Sheriff’s Department) to Downtown Los Angeles only two blocks from LAPD headquarters. I am now an eligible voter in the City of Los Angeles. While I have served the city through organizations like PATH, Big Brothers Big Sisters and the Downtown Women’s Center, my interest in the growth and safety of the city has exponentially piqued.
The Data
As a new resident of the city, I was particularly interested to learn about its crime trends. I found that depending on where I was and who I asked about the safety of that neighborhood, opinions varied. Luckily, a quick internet search showed that datasets on various municipal services, including crime reported by the LAPD, are available via an open data portal. Crime incident data is updated weekly and all portal data is open to the public at no cost.
The dataset I selected reflects crime in the city dating back to 2010. Data is transcribed from original crime reports that are typed on paper. As such, there may be some inaccuracies and some fields are missing data. There are over 1.6 MM rows, each representing a crime incident and includes information like the incident’s location, date occurred, date reported, descriptions of the crime and premise, and investigation status. I decided to look at the types of crimes by LAPD Division from 2010-2017. Given the development I’ve seen across the city since moving to the area in 2010, I wanted to understand how neighborhood safety was changing.
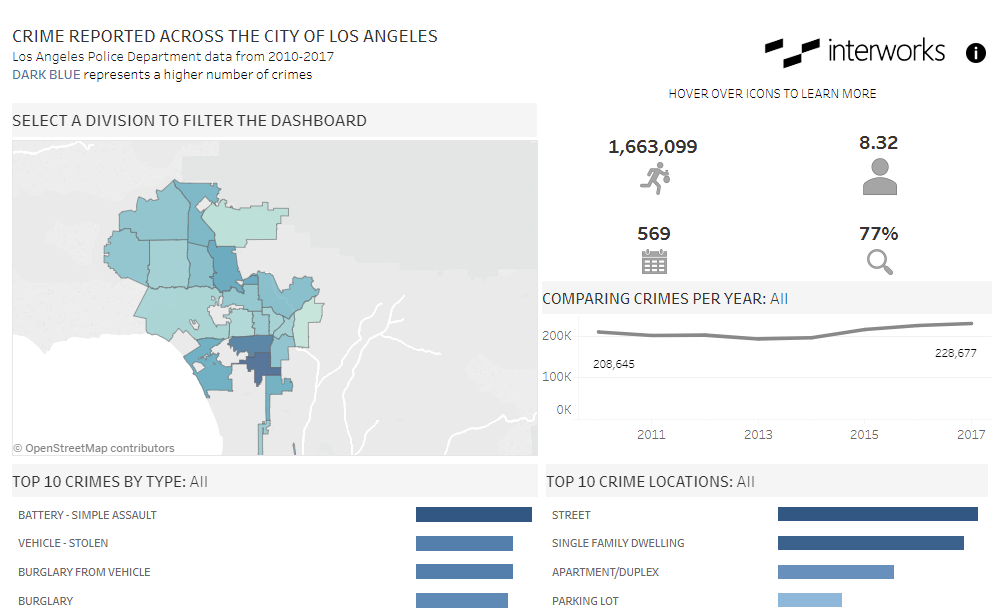
The Dashboard
To create a custom map by LAPD Division, I joined the portal data with a spatial file that maps the 21 LAPD Divisions and is publicly available on the LA Times website. There was some data preparation needed to ensure the dataset was limited to necessary fields for optimal performance and could be joined on division name with the spatial file. I utilized both Dataiku and Tableau’s Data Source Connection window to accomplish this.
With over one million crime incidents, 140 types of crimes and 300 location descriptions, the dashboard is limited to the top ten types of crimes and locations – citywide and by division. Crime per capita (calculated using division population estimates from the LAPD’s website), percent of investigations that are still ongoing and total crimes by division are included. I opted for an interactive map so users could filter the data at division levels that interest them.
It was fascinating to see how the volume of incidents has changed since the end of the Recession and in areas of the city currently known for heavy real estate development. Readers considering moving within or to the area may find the information here useful as they search for housing. It was also interesting to see that crimes like identity and vehicle theft are high in certain areas, whereas citywide battery/simple assault is the top crime. Overall, I hope you find this information as captivating as I did. Enjoy exploring the dashboard below:

The Latest
-

PYD129 – Tableau Conference History with Dan Murray
23 April, 2024


